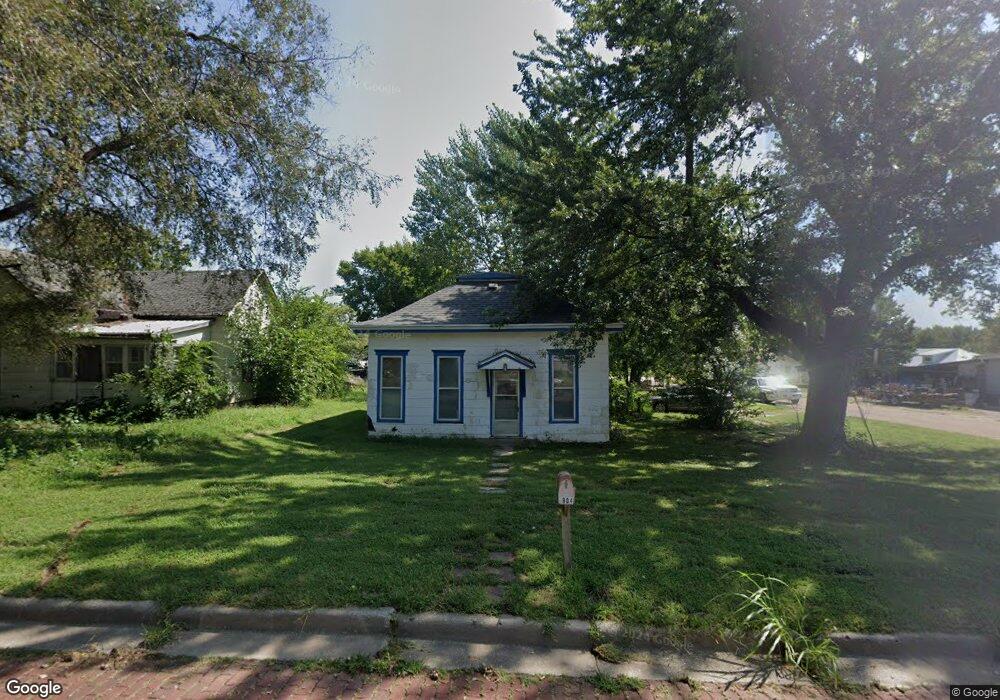
904 Stone St Falls City, NE 68355
Estimated Value: $42,000 - $70,000
2
Beds
1
Bath
772
Sq Ft
$76/Sq Ft
Est. Value
About This Home
This home is located at 904 Stone St, Falls City, NE 68355 and is currently estimated at $58,853, approximately $76 per square foot. 904 Stone St is a home located in Richardson County with nearby schools including Falls City North Elementary School, Falls City South Elementary School, and Falls City Middle School.
Ownership History
Date
Name
Owned For
Owner Type
Purchase Details
Closed on
Sep 16, 2015
Sold by
Moyer Richard N and Moyer Wanda J
Bought by
Fitzpatrick Patrice M
Current Estimated Value
Purchase Details
Closed on
Sep 25, 2013
Sold by
Goings Tony Ray and Goings Connie Irene
Bought by
James Colton and James Allison
Purchase Details
Closed on
May 13, 2008
Sold by
Hart Loren D and Hart Deborah L
Bought by
Moyer Richard N and Moyer Wanda J
Purchase Details
Closed on
May 15, 2000
Sold by
Tackett Richard Q and Tackett Mary H
Bought by
Hart Loren D and Hart Deborah L
Create a Home Valuation Report for This Property
The Home Valuation Report is an in-depth analysis detailing your home's value as well as a comparison with similar homes in the area
Home Values in the Area
Average Home Value in this Area
Purchase History
| Date | Buyer | Sale Price | Title Company |
|---|---|---|---|
| Fitzpatrick Patrice M | $6,000 | -- | |
| James Colton | -- | -- | |
| Moyer Richard N | -- | -- | |
| Hart Loren D | $12,500 | -- |
Source: Public Records
Tax History Compared to Growth
Tax History
| Year | Tax Paid | Tax Assessment Tax Assessment Total Assessment is a certain percentage of the fair market value that is determined by local assessors to be the total taxable value of land and additions on the property. | Land | Improvement |
|---|---|---|---|---|
| 2025 | $99 | $8,809 | $3,000 | $5,809 |
| 2024 | $99 | $8,480 | $3,000 | $5,480 |
| 2023 | $156 | $9,508 | $3,000 | $6,508 |
| 2022 | $152 | $7,900 | $1,620 | $6,280 |
| 2021 | $261 | $13,952 | $1,620 | $12,332 |
| 2020 | $253 | $13,365 | $1,620 | $11,745 |
| 2019 | $251 | $13,023 | $1,620 | $11,403 |
| 2018 | $247 | $12,691 | $1,620 | $11,071 |
| 2017 | $247 | $12,691 | $1,620 | $11,071 |
| 2016 | $240 | $12,369 | $1,620 | $10,749 |
| 2015 | -- | $12,369 | $1,620 | $10,749 |
| 2014 | -- | $12,369 | $1,620 | $10,749 |
Source: Public Records
Map
Nearby Homes