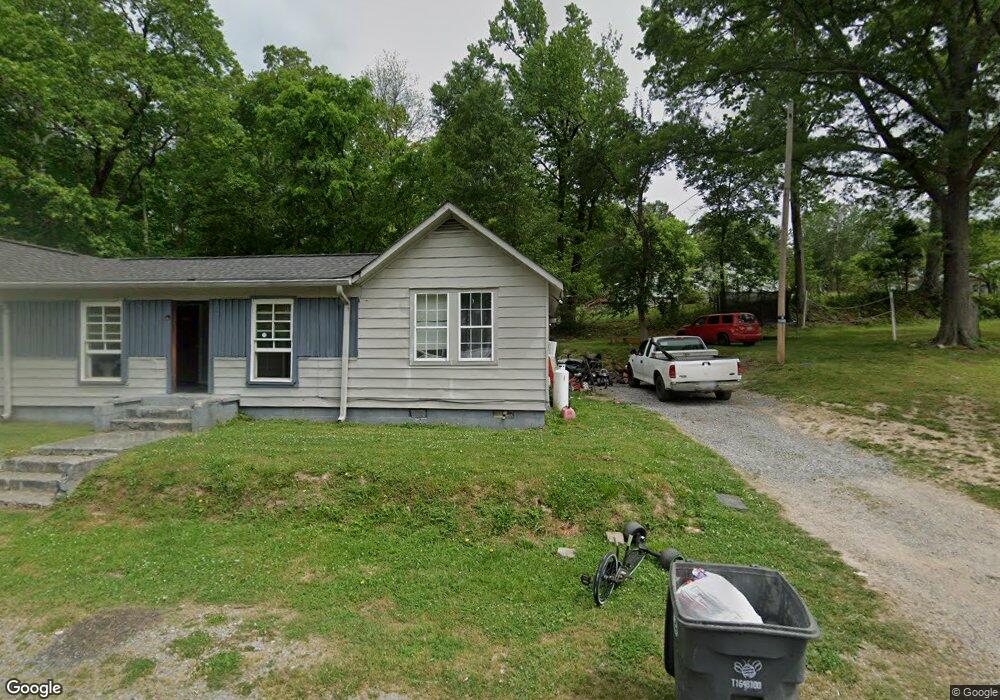
904 Thompson St La Fayette, GA 30728
Estimated Value: $136,000 - $216,000
--
Bed
2
Baths
1,445
Sq Ft
$126/Sq Ft
Est. Value
About This Home
This home is located at 904 Thompson St, La Fayette, GA 30728 and is currently estimated at $181,948, approximately $125 per square foot. 904 Thompson St is a home located in Walker County with nearby schools including Gilbert Elementary School, Lafayette Middle School, and Lafayette High School.
Ownership History
Date
Name
Owned For
Owner Type
Purchase Details
Closed on
Dec 21, 2011
Sold by
Baker George P
Bought by
Baker Howard Eugene
Current Estimated Value
Purchase Details
Closed on
Jan 1, 1979
Sold by
Baker George P and Baker Peggy L
Bought by
Baker George P
Purchase Details
Closed on
Oct 17, 1975
Sold by
Bailey Annie
Bought by
Baker George P and Baker Peggy L
Purchase Details
Closed on
Aug 15, 1973
Sold by
Arnold M R
Bought by
Bailey Annie
Purchase Details
Closed on
Aug 14, 1973
Sold by
Bailey Annie
Bought by
Arnold M R
Purchase Details
Closed on
Jan 1, 1972
Bought by
Bailey Annie
Create a Home Valuation Report for This Property
The Home Valuation Report is an in-depth analysis detailing your home's value as well as a comparison with similar homes in the area
Home Values in the Area
Average Home Value in this Area
Purchase History
| Date | Buyer | Sale Price | Title Company |
|---|---|---|---|
| Baker Howard Eugene | -- | -- | |
| Baker George P | -- | -- | |
| Baker George P | -- | -- | |
| Bailey Annie | -- | -- | |
| Arnold M R | -- | -- | |
| Bailey Annie | -- | -- |
Source: Public Records
Tax History Compared to Growth
Tax History
| Year | Tax Paid | Tax Assessment Tax Assessment Total Assessment is a certain percentage of the fair market value that is determined by local assessors to be the total taxable value of land and additions on the property. | Land | Improvement |
|---|---|---|---|---|
| 2024 | $1,651 | $69,332 | $7,125 | $62,207 |
| 2023 | $1,627 | $66,292 | $7,125 | $59,167 |
| 2022 | $1,793 | $68,110 | $6,229 | $61,881 |
| 2021 | $819 | $27,902 | $5,760 | $22,142 |
| 2020 | $768 | $25,020 | $5,760 | $19,260 |
| 2019 | $768 | $25,020 | $5,760 | $19,260 |
| 2018 | $744 | $25,020 | $5,760 | $19,260 |
| 2017 | $832 | $25,020 | $5,760 | $19,260 |
| 2016 | $690 | $25,020 | $5,760 | $19,260 |
| 2015 | $717 | $24,759 | $5,808 | $18,951 |
| 2014 | $765 | $27,450 | $5,808 | $21,642 |
| 2013 | -- | $30,379 | $5,808 | $24,571 |
Source: Public Records
Map
Nearby Homes
- 206 Glenn St
- 205 Cavender St
- 310 Glenn St
- 0 W Main St Unit 1518094
- 307 Cavender St
- 312 Pine St
- 301 Cedar St
- 0 Walnut St Unit 1522902
- 317 Cedar St
- 316 Chestnut St
- 408 Chestnut St
- 1002 Colerain St
- 204 S High St
- 908 Gilbert Ln
- 707 Gilbert Ln
- 405 Magnolia St
- 212 S High St
- 800 Mclemore St
- 802 Mclemore St
- 712 Mclemore St
- 303 Glen St
- 204 Glenn St
- 304 Glenn St
- 906 Thompson St
- 301 Glenn St
- 205 Glenn St
- 301 Warrenfells St
- 306 Glenn St
- 303 Glenn St
- 203 Glenn St
- 308 Warrenfells St
- 310 Warrenfells St
- 312 Warrenfells St
- 314 Warrenfells St
- 201 Glenn St
- 303 Warrenfells St
- 303 and 30 Warrenfells St
- 303 Warrenfells St
- 0 Warrenfells St Unit 1019253
- 0 Warrenfells St Unit 8385016