
Landlord's Agent in 2024
Kathy Scott
TX Prime RE/Blue Ribbon PM
(979) 587-8295
82 Total Sales


Estimated Value: $126,901 - $134,000
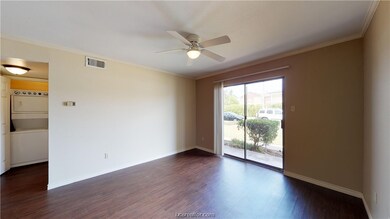
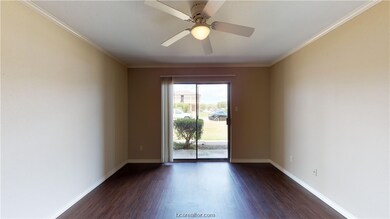
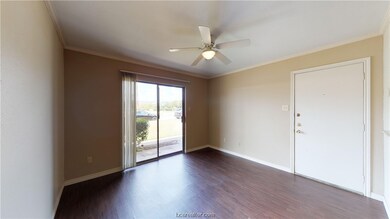
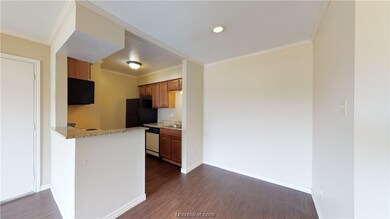
AVAILABLE FOR JULY MOVE-IN! Your own 1 bedroom, 1 bath downstairs condo with washer/dryer. Located on the TAMU bus route, it's also a short walk to shopping, restaurants and entertainment. This condo has been updated with new cabinets, granite countertops and crown molding. The living room, kitchen, and bathroom has wood look vinyl plank. Located across from the Wolf Pen Creek jogging trails which lead to the Wolf Pen Creek amphitheater. Cripple Creek Condos has a swimming pool and tennis courts. A 3D immersive visual tour of this home created by Matterport is available online. Ask your agent for a link to tour online. All leases participate in the Latchel Resident Benefit package. The additional fee for this package is $20 per month.
Last Agent to Rent the Property
TX Prime RE/Blue Ribbon PM License #0589435 Listed on: 02/26/2024
| Date | Event | Price | List to Sale | Price per Sq Ft |
|---|---|---|---|---|
| 06/03/2024 06/03/24 | Rented | $900 | 0.0% | -- |
| 05/30/2024 05/30/24 | Under Contract | -- | -- | -- |
| 04/30/2024 04/30/24 | Price Changed | $900 | -10.0% | $1 / Sq Ft |
| 04/14/2024 04/14/24 | Off Market | $1,000 | -- | -- |
| 03/19/2024 03/19/24 | For Rent | $1,000 | 0.0% | -- |
| 02/26/2024 02/26/24 | For Rent | $1,000 | +21.2% | -- |
| 08/07/2023 08/07/23 | Off Market | $825 | -- | -- |
| 05/08/2023 05/08/23 | Rented | $825 | -2.9% | -- |
| 05/01/2023 05/01/23 | Under Contract | -- | -- | -- |
| 03/31/2023 03/31/23 | For Rent | $850 | +13.3% | -- |
| 04/06/2021 04/06/21 | Rented | $750 | 0.0% | -- |
| 03/07/2021 03/07/21 | Under Contract | -- | -- | -- |
| 12/21/2020 12/21/20 | For Rent | $750 | 0.0% | -- |
| 04/28/2020 04/28/20 | Rented | $750 | 0.0% | -- |
| 03/29/2020 03/29/20 | Under Contract | -- | -- | -- |
| 11/13/2019 11/13/19 | For Rent | $750 | +25.0% | -- |
| 11/13/2018 11/13/18 | Rented | $600 | -22.6% | -- |
| 10/14/2018 10/14/18 | Under Contract | -- | -- | -- |
| 04/09/2018 04/09/18 | For Rent | $775 | -- | -- |
| Year | Tax Paid | Tax Assessment Tax Assessment Total Assessment is a certain percentage of the fair market value that is determined by local assessors to be the total taxable value of land and additions on the property. | Land | Improvement |
|---|---|---|---|---|
| 2025 | $2,432 | $117,333 | $24,000 | $93,333 |
| 2024 | $2,432 | $127,639 | $18,500 | $109,139 |
| 2023 | $2,432 | $113,271 | $16,500 | $96,771 |
| 2022 | $1,886 | $88,443 | $15,000 | $73,443 |
| 2021 | $1,855 | $82,140 | $15,000 | $67,140 |
| 2020 | $1,690 | $74,405 | $15,000 | $59,405 |
| 2019 | $1,792 | $75,860 | $15,000 | $60,860 |
| 2018 | $1,818 | $76,360 | $15,000 | $61,360 |
| 2017 | $1,509 | $64,110 | $15,000 | $49,110 |
| 2016 | $1,394 | $59,220 | $10,000 | $49,220 |
| 2015 | $1,206 | $55,080 | $10,000 | $45,080 |
| 2014 | $1,206 | $52,030 | $10,000 | $42,030 |
Landlord's Agent in 2024
Kathy Scott
TX Prime RE/Blue Ribbon PM
(979) 587-8295
82 Total Sales
T
Tenant's Agent in 2024
Theresa Armijo
eXp Realty, LLC
(979) 450-8706
7 Total Sales
Buyer's Agent in 2023
Kayla Robison
Aggieland Properties
(936) 718-3529
29 Total Sales
C
Buyer's Agent in 2020
Cara Miller
TX Prime RE/Blue Ribbon PM
(281) 799-3873
49 Total Sales
Source: Bryan-College Station Regional Multiple Listing Service
MLS Number: 24002894
APN: 76599
Disclaimer: Certain information contained herein is derived from information provided by parties other than Homes.com. All information provided is deemed reliable, but is not guaranteed to be accurate and should be independently verified.
![]() IDX information is provided exclusively for personal, non-commercial use, and may not be used for any purpose other than to identify prospective properties consumers may be interested in purchasing.
IDX information is provided exclusively for personal, non-commercial use, and may not be used for any purpose other than to identify prospective properties consumers may be interested in purchasing.
Information is deemed reliable but not guaranteed.