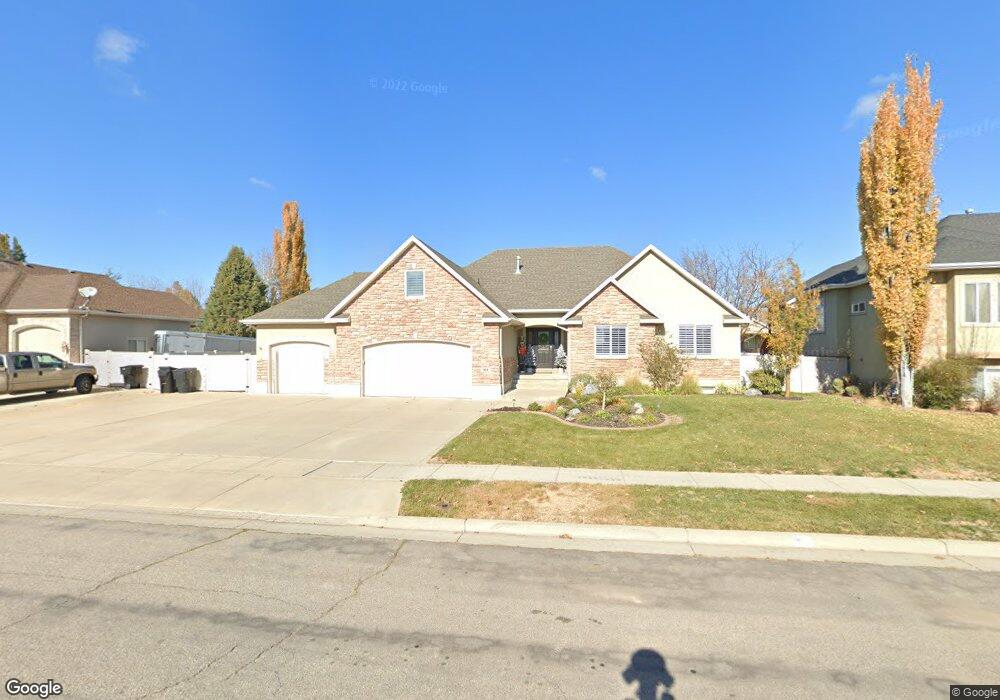
904 W 2920 S Unit 72 Syracuse, UT 84075
Estimated Value: $760,000 - $888,000
7
Beds
5
Baths
5,119
Sq Ft
$161/Sq Ft
Est. Value
About This Home
This home is located at 904 W 2920 S Unit 72, Syracuse, UT 84075 and is currently estimated at $823,079, approximately $160 per square foot. 904 W 2920 S Unit 72 is a home located in Davis County with nearby schools including Bluff Ridge Elementary, Legacy Junior High School, and Clearfield High School.
Ownership History
Date
Name
Owned For
Owner Type
Purchase Details
Closed on
Oct 8, 2021
Sold by
State Of Utah
Bought by
Hodges Travis S and Hodges Daniclle G
Current Estimated Value
Home Financials for this Owner
Home Financials are based on the most recent Mortgage that was taken out on this home.
Original Mortgage
$536,580
Outstanding Balance
$488,248
Interest Rate
2.8%
Mortgage Type
New Conventional
Estimated Equity
$334,831
Purchase Details
Closed on
Mar 26, 2018
Sold by
Sparrow Norman Gregg and Sparrow Kristy W
Bought by
Craig Randy H and Craig Betty
Purchase Details
Closed on
Jul 24, 2001
Sold by
Waynell Investments Llc
Bought by
Sparrow Norman Gregg and Sparrow Kristy W
Home Financials for this Owner
Home Financials are based on the most recent Mortgage that was taken out on this home.
Original Mortgage
$225,000
Interest Rate
7.15%
Create a Home Valuation Report for This Property
The Home Valuation Report is an in-depth analysis detailing your home's value as well as a comparison with similar homes in the area
Home Values in the Area
Average Home Value in this Area
Purchase History
| Date | Buyer | Sale Price | Title Company |
|---|---|---|---|
| Hodges Travis S | -- | Metro Natl Title Ass | |
| Craig Randy H | -- | Backman Title | |
| Sparrow Norman Gregg | -- | Bonneville Title Company Inc |
Source: Public Records
Mortgage History
| Date | Status | Borrower | Loan Amount |
|---|---|---|---|
| Open | Hodges Travis S | $536,580 | |
| Previous Owner | Sparrow Norman Gregg | $225,000 |
Source: Public Records
Tax History Compared to Growth
Tax History
| Year | Tax Paid | Tax Assessment Tax Assessment Total Assessment is a certain percentage of the fair market value that is determined by local assessors to be the total taxable value of land and additions on the property. | Land | Improvement |
|---|---|---|---|---|
| 2025 | $4,270 | $411,950 | $127,953 | $283,997 |
| 2024 | $4,179 | $405,900 | $108,737 | $297,163 |
| 2023 | $4,108 | $727,000 | $151,343 | $575,657 |
| 2022 | $4,319 | $419,100 | $86,715 | $332,385 |
| 2021 | $0 | $530,000 | $128,479 | $401,521 |
| 2020 | $3,205 | $466,000 | $110,452 | $355,548 |
| 2019 | $3,079 | $442,000 | $109,759 | $332,241 |
| 2018 | $2,414 | $344,000 | $105,034 | $238,966 |
| 2016 | $2,204 | $164,670 | $40,248 | $124,422 |
| 2015 | $2,235 | $159,060 | $40,248 | $118,812 |
| 2014 | $2,204 | $159,849 | $40,248 | $119,601 |
| 2013 | -- | $163,465 | $38,213 | $125,252 |
Source: Public Records
Map
Nearby Homes