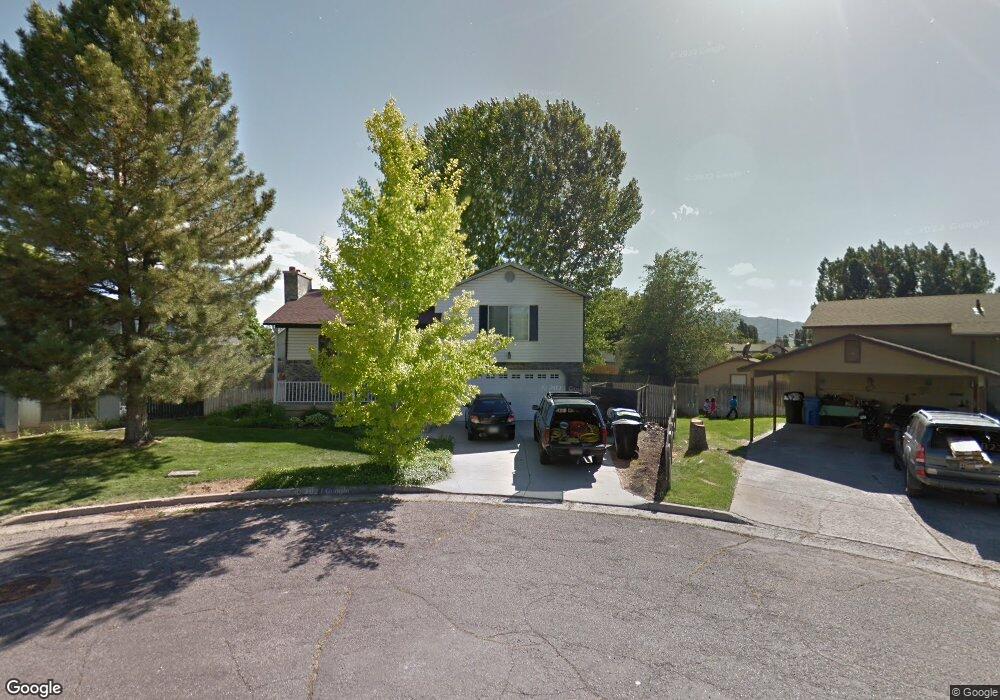
904 W 330 S Logan, UT 84321
Woodruff NeighborhoodEstimated Value: $364,409 - $383,000
--
Bed
--
Bath
1,130
Sq Ft
$330/Sq Ft
Est. Value
About This Home
This home is located at 904 W 330 S, Logan, UT 84321 and is currently estimated at $373,352, approximately $330 per square foot. 904 W 330 S is a home with nearby schools including Woodruff School, Mount Logan Middle School, and Logan High School.
Ownership History
Date
Name
Owned For
Owner Type
Purchase Details
Closed on
Aug 31, 2012
Sold by
Susman Ezekiel A and Susman Lacy R
Bought by
Sim Houston and Sim Hayley
Current Estimated Value
Home Financials for this Owner
Home Financials are based on the most recent Mortgage that was taken out on this home.
Original Mortgage
$135,900
Outstanding Balance
$93,007
Interest Rate
3.49%
Mortgage Type
New Conventional
Estimated Equity
$280,345
Create a Home Valuation Report for This Property
The Home Valuation Report is an in-depth analysis detailing your home's value as well as a comparison with similar homes in the area
Home Values in the Area
Average Home Value in this Area
Purchase History
| Date | Buyer | Sale Price | Title Company |
|---|---|---|---|
| Sim Houston | -- | Hickman Land Title Company |
Source: Public Records
Mortgage History
| Date | Status | Borrower | Loan Amount |
|---|---|---|---|
| Open | Sim Houston | $135,900 |
Source: Public Records
Tax History Compared to Growth
Tax History
| Year | Tax Paid | Tax Assessment Tax Assessment Total Assessment is a certain percentage of the fair market value that is determined by local assessors to be the total taxable value of land and additions on the property. | Land | Improvement |
|---|---|---|---|---|
| 2025 | $1,539 | $199,100 | $0 | $0 |
| 2024 | $1,592 | $199,415 | $0 | $0 |
| 2023 | $1,649 | $196,945 | $0 | $0 |
| 2022 | $1,438 | $160,290 | $0 | $0 |
| 2021 | $1,408 | $242,475 | $46,650 | $195,825 |
| 2020 | $1,110 | $172,138 | $46,650 | $125,488 |
| 2019 | $1,161 | $172,138 | $46,650 | $125,488 |
| 2018 | $1,150 | $155,770 | $46,650 | $109,120 |
| 2017 | $1,046 | $74,910 | $0 | $0 |
| 2016 | $1,085 | $74,910 | $0 | $0 |
| 2015 | $1,023 | $70,585 | $0 | $0 |
| 2014 | $925 | $70,585 | $0 | $0 |
| 2013 | -- | $70,585 | $0 | $0 |
Source: Public Records
Map
Nearby Homes
- 2399 W 430 S Unit 33
- 501 Southwest St
- 1099 Three Pointe Ave
- 248 Sunstone Ct
- 553 Center Ave
- 370 S 1200 W Unit 2
- 658 W 500 S
- 1177 130 S
- 985 W 720 S
- 1271 W 350 S
- 506 S 1225 W
- 1220 W 575 S
- 518 S 1225 W
- 1227 W 500 S Unit 151
- 542 S 1225 W Unit 116
- 548 S 1225 W Unit 115
- 736 Majestic Dr
- 1239 W 575 S Unit 152
- Hemlock Plan at Sugar Creek - Logan
- Eucalyptus Plan at Sugar Creek - Logan