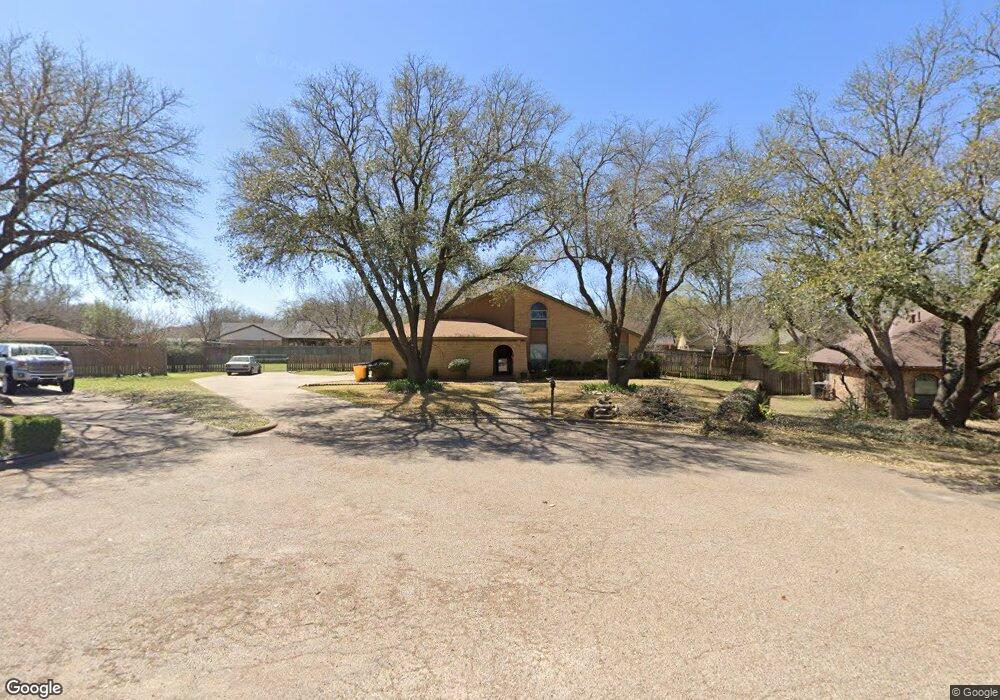
904 Willowcreek Ct Cleburne, TX 76033
Estimated Value: $314,000 - $345,763
4
Beds
3
Baths
2,162
Sq Ft
$154/Sq Ft
Est. Value
About This Home
This home is located at 904 Willowcreek Ct, Cleburne, TX 76033 and is currently estimated at $333,441, approximately $154 per square foot. 904 Willowcreek Ct is a home located in Johnson County with nearby schools including Coleman Elementary School, Lowell Smith Jr. Middle School, and Cleburne High School.
Ownership History
Date
Name
Owned For
Owner Type
Purchase Details
Closed on
Feb 12, 2018
Sold by
Perkins Clyde J and Perkins Debbie
Bought by
Pecorino Frank A and Pecorino Melinda D
Current Estimated Value
Home Financials for this Owner
Home Financials are based on the most recent Mortgage that was taken out on this home.
Original Mortgage
$198,850
Outstanding Balance
$168,408
Interest Rate
3.99%
Mortgage Type
New Conventional
Estimated Equity
$165,033
Purchase Details
Closed on
Oct 28, 2005
Sold by
Hill William H and Hill Julia S
Bought by
Perkins Clyde J and Perkins Debbie
Home Financials for this Owner
Home Financials are based on the most recent Mortgage that was taken out on this home.
Original Mortgage
$116,000
Interest Rate
5.9%
Mortgage Type
Stand Alone First
Create a Home Valuation Report for This Property
The Home Valuation Report is an in-depth analysis detailing your home's value as well as a comparison with similar homes in the area
Home Values in the Area
Average Home Value in this Area
Purchase History
| Date | Buyer | Sale Price | Title Company |
|---|---|---|---|
| Pecorino Frank A | -- | Old Republic Title | |
| Perkins Clyde J | -- | Fatco |
Source: Public Records
Mortgage History
| Date | Status | Borrower | Loan Amount |
|---|---|---|---|
| Open | Pecorino Frank A | $198,850 | |
| Previous Owner | Perkins Clyde J | $116,000 |
Source: Public Records
Tax History Compared to Growth
Tax History
| Year | Tax Paid | Tax Assessment Tax Assessment Total Assessment is a certain percentage of the fair market value that is determined by local assessors to be the total taxable value of land and additions on the property. | Land | Improvement |
|---|---|---|---|---|
| 2025 | $5,352 | $305,222 | $65,000 | $240,222 |
| 2024 | $6,805 | $305,222 | $65,000 | $240,222 |
| 2023 | $5,171 | $305,222 | $65,000 | $240,222 |
| 2022 | $6,237 | $312,923 | $55,000 | $257,923 |
| 2021 | $6,730 | $286,008 | $50,000 | $236,008 |
| 2020 | $6,168 | $222,597 | $35,000 | $187,597 |
| 2019 | $6,380 | $215,920 | $35,000 | $180,920 |
| 2018 | $6,383 | $215,920 | $35,000 | $180,920 |
| 2017 | $6,201 | $210,908 | $35,000 | $175,908 |
| 2016 | $4,634 | $157,412 | $35,000 | $122,412 |
| 2015 | $3,352 | $157,412 | $35,000 | $122,412 |
| 2014 | $3,352 | $138,578 | $35,000 | $103,578 |
Source: Public Records
Map
Nearby Homes
- 909 Highland Dr
- 4112 Highland Dr
- 4101 Highland Dr
- 1115 Green River Trail
- 1104 Cherrywood Dr
- 1103 Trace Rd
- 840 S Ridgeway Dr
- 1116 Willowcreek Rd
- 1208 Cindy Ln
- 616 Bellevue Dr
- 1104 Lynnwood Dr
- 1211 Greenbriar Ln
- 1107 Stanwood Ave
- 311 Sunset Dr
- 1204 W Westhill Dr
- 1503 Stanwood Ave
- 1027 Spring Azure Dr
- 714 Forrest Ave
- 215 Sunset Dr
- 1302 Cindy Ct
- 902 Willowcreek Ct
- 906 Willowcreek Ct
- 907 Highland Dr
- 905 Highland Dr
- 915 Highland Dr
- 905 Willowcreek Ct
- 903 Willowcreek Ct
- 919 Highland Dr
- 4105 Highland Dr
- 4016 Highland Dr
- 1005 Willowcreek Rd
- 903 Highland Dr
- 922 Highland Dr
- 1003 Willowcreek Rd
- 908 Highland Dr
- 910 Highland Dr
- 906 Highland Dr
- 926 Highland Dr
- 912 Highland Dr
- 1007 Willowcreek Rd