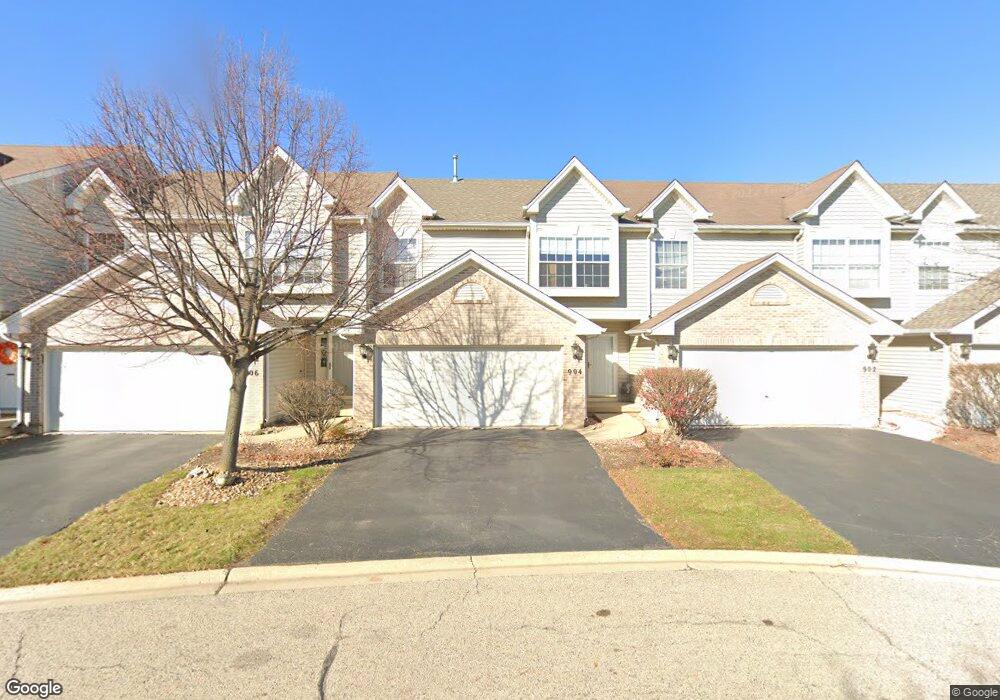
904 Windstone Ct Lake In the Hills, IL 60156
Estimated Value: $278,377 - $298,000
2
Beds
2
Baths
1,735
Sq Ft
$165/Sq Ft
Est. Value
About This Home
This home is located at 904 Windstone Ct, Lake In the Hills, IL 60156 and is currently estimated at $287,094, approximately $165 per square foot. 904 Windstone Ct is a home located in McHenry County with nearby schools including Westfield Community School, Lake in the Hills Elementary School, and United Junior High School.
Ownership History
Date
Name
Owned For
Owner Type
Purchase Details
Closed on
Oct 17, 2002
Sold by
Jacques Jacqueline A and Keegan Helen R
Bought by
Caballero J Alfredo
Current Estimated Value
Home Financials for this Owner
Home Financials are based on the most recent Mortgage that was taken out on this home.
Original Mortgage
$172,296
Outstanding Balance
$72,920
Interest Rate
6.29%
Mortgage Type
FHA
Estimated Equity
$214,174
Purchase Details
Closed on
Oct 29, 1997
Sold by
Windmere Cove Partners Inc
Bought by
Jacques Jacqueline A and Keegan Helen R
Home Financials for this Owner
Home Financials are based on the most recent Mortgage that was taken out on this home.
Original Mortgage
$135,550
Interest Rate
7.42%
Mortgage Type
FHA
Create a Home Valuation Report for This Property
The Home Valuation Report is an in-depth analysis detailing your home's value as well as a comparison with similar homes in the area
Home Values in the Area
Average Home Value in this Area
Purchase History
| Date | Buyer | Sale Price | Title Company |
|---|---|---|---|
| Caballero J Alfredo | $175,000 | -- | |
| Jacques Jacqueline A | $139,000 | Chicago Title |
Source: Public Records
Mortgage History
| Date | Status | Borrower | Loan Amount |
|---|---|---|---|
| Open | Caballero J Alfredo | $172,296 | |
| Previous Owner | Jacques Jacqueline A | $135,550 |
Source: Public Records
Tax History Compared to Growth
Tax History
| Year | Tax Paid | Tax Assessment Tax Assessment Total Assessment is a certain percentage of the fair market value that is determined by local assessors to be the total taxable value of land and additions on the property. | Land | Improvement |
|---|---|---|---|---|
| 2024 | $5,928 | $82,095 | $15,727 | $66,368 |
| 2023 | $5,620 | $73,424 | $14,066 | $59,358 |
| 2022 | $5,197 | $64,699 | $12,695 | $52,004 |
| 2021 | $4,985 | $60,275 | $11,827 | $48,448 |
| 2020 | $4,855 | $58,141 | $11,408 | $46,733 |
| 2019 | $4,748 | $55,648 | $10,919 | $44,729 |
| 2018 | $4,528 | $51,407 | $10,087 | $41,320 |
| 2017 | $4,425 | $48,429 | $9,503 | $38,926 |
| 2016 | $4,342 | $45,422 | $8,913 | $36,509 |
| 2013 | $2,308 | $48,895 | $8,315 | $40,580 |
Source: Public Records
Map
Nearby Homes
- 900 Windstone Ct
- 937 Mesa Dr
- 809 Menominee Dr
- 807 Menominee Dr
- 909 Roger St
- 7 Michael Ct
- LOT 3 Blackhawk Dr
- 16 Brian Ct
- 992 Mcphee Dr
- 266 Grandview Ct
- 1431 Essex St
- 1049 Horizon Ridge
- Lots 10 & 11 Ramble Rd
- 70 Hilltop Dr Unit 4
- 1019 Maple St
- 135 Arquilla Dr
- 721 Brentwood Ct
- 1235 Fairmont Ct
- 1114 Ash St
- 1345 Cunat Ct Unit 1B
- 902 Windstone Ct
- 906 Windstone Ct
- 908 Windstone Ct
- 910 Windstone Ct
- 912 Windstone Ct
- 914 Windstone Ct
- 916 Windstone Ct
- 921 Mesa Dr
- 920 Mesa Dr
- 923 Mesa Dr
- 923 Mesa Dr Unit 923
- 922 Mesa Dr
- 918 Windstone Ct
- 1122 Viewpoint Dr
- 924 Mesa Dr
- 920 Windstone Ct
- 927 Mesa Dr
- 922 Windstone Ct
- 926 Mesa Dr
- 924 Windstone Ct