
Landlord's Agent in 2024
Cindy Napp
Diane Turton, Realtors-Spring Lake
(732) 859-7808
6 in this area
56 Total Sales


Estimated Value: $807,000 - $1,050,187
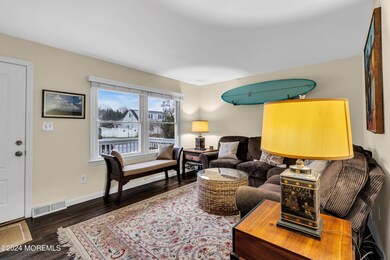
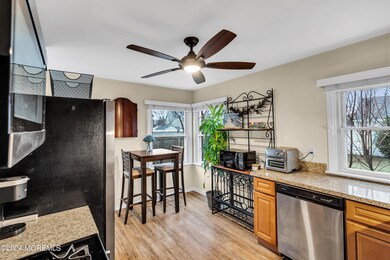
Delight in a summer getaway at this charming 3-bedroom, 2-bathroom seashore cape located just moments away from the pristine beaches of Spring Lake. Embrace a relaxed beach vibe of this sweet house, complete with a welcoming front porch, a spacious grassy private yard, and a patio equipped with a grill.
This turnkey rental comes with the added convenience of two Spring Lake beach and pool badges. Make the Summer of 2024 truly memorable at this Jersey Shore getaway. Available 7.6-8.3
Monthly rates June $9,600, July $12,500 Weekly rates for the summer are as follows: June 3rd to June 17th: $2,300, June 17th to July 1st: $2,500, July 1st to August 3rd: $3,300.
Last Agent to Rent the Property
Diane Turton, Realtors-Spring Lake License #1005282 Listed on: 02/02/2024
Last Renter's Agent
Diane Turton, Realtors-Spring Lake License #1005282 Listed on: 02/02/2024
| Date | Buyer | Sale Price | Title Company |
|---|---|---|---|
| Burrus Richard | $399 | None Available |
| Date | Event | Price | List to Sale | Price per Sq Ft | Prior Sale |
|---|---|---|---|---|---|
| 07/24/2024 07/24/24 | Rented | $3,300 | 0.0% | -- | |
| 02/02/2024 02/02/24 | For Rent | $3,300 | 0.0% | -- | |
| 05/19/2017 05/19/17 | Sold | $399,900 | -- | $339 / Sq Ft | View Prior Sale |
| Year | Tax Paid | Tax Assessment Tax Assessment Total Assessment is a certain percentage of the fair market value that is determined by local assessors to be the total taxable value of land and additions on the property. | Land | Improvement |
|---|---|---|---|---|
| 2025 | $7,157 | $737,400 | $576,800 | $160,600 |
| 2024 | $6,487 | $679,700 | $506,500 | $173,200 |
| 2023 | $6,487 | $579,200 | $410,000 | $169,200 |
| 2022 | $6,346 | $530,700 | $326,000 | $204,700 |
| 2021 | $6,346 | $470,100 | $284,000 | $186,100 |
| 2020 | $6,150 | $452,900 | $284,000 | $168,900 |
| 2019 | $6,149 | $448,200 | $284,000 | $164,200 |
| 2018 | $6,211 | $440,500 | $284,000 | $156,500 |
| 2017 | $5,965 | $438,600 | $284,000 | $154,600 |
| 2016 | $6,012 | $436,600 | $284,000 | $152,600 |
| 2015 | $5,941 | $432,700 | $284,000 | $148,700 |
| 2014 | $5,798 | $431,700 | $284,000 | $147,700 |
Landlord's Agent in 2024
Cindy Napp
Diane Turton, Realtors-Spring Lake
(732) 859-7808
6 in this area
56 Total Sales
B
Seller's Agent in 2017
Bart Dennin
Ocean Pointe
Source: MOREMLS (Monmouth Ocean Regional REALTORS®)
MLS Number: 22403011
APN: 48-00084-0000-00089
Disclaimer: Certain information contained herein is derived from information provided by parties other than Homes.com. All information provided is deemed reliable, but is not guaranteed to be accurate and should be independently verified.
![]() IDX information is provided exclusively for personal, non-commercial use, and may not be used for any purpose other than to identify prospective properties consumers may be interested in purchasing.
IDX information is provided exclusively for personal, non-commercial use, and may not be used for any purpose other than to identify prospective properties consumers may be interested in purchasing.
Information is deemed reliable but not guaranteed.