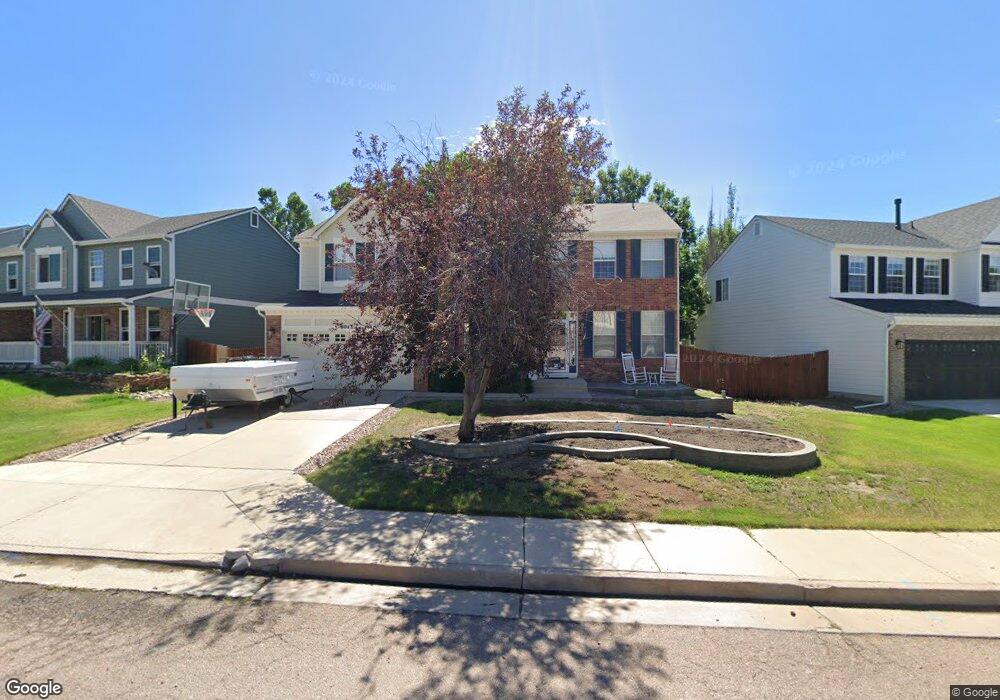
9043 Musgrave St Colorado Springs, CO 80920
Briargate NeighborhoodEstimated Value: $590,014 - $686,000
5
Beds
4
Baths
2,816
Sq Ft
$225/Sq Ft
Est. Value
About This Home
This home is located at 9043 Musgrave St, Colorado Springs, CO 80920 and is currently estimated at $633,254, approximately $224 per square foot. 9043 Musgrave St is a home located in El Paso County with nearby schools including Explorer Elementary School, Timberview Middle School, and Liberty High School.
Ownership History
Date
Name
Owned For
Owner Type
Purchase Details
Closed on
Sep 30, 2010
Sold by
Perkins John
Bought by
Fenicle Michael D and Fenicle Michelle D
Current Estimated Value
Home Financials for this Owner
Home Financials are based on the most recent Mortgage that was taken out on this home.
Original Mortgage
$240,000
Outstanding Balance
$159,259
Interest Rate
4.46%
Mortgage Type
New Conventional
Estimated Equity
$473,995
Purchase Details
Closed on
Sep 27, 2002
Sold by
Privett Arlan K and Privett Leann
Bought by
Perkins John and Perkins Diana
Home Financials for this Owner
Home Financials are based on the most recent Mortgage that was taken out on this home.
Original Mortgage
$175,800
Interest Rate
6.21%
Purchase Details
Closed on
Aug 18, 1999
Sold by
Richmond American Homes Of Colorado Inc
Bought by
Privett Arlan K and Privett Leann
Home Financials for this Owner
Home Financials are based on the most recent Mortgage that was taken out on this home.
Original Mortgage
$224,600
Interest Rate
7.68%
Purchase Details
Closed on
Mar 1, 1987
Bought by
Fenicle Michael D
Create a Home Valuation Report for This Property
The Home Valuation Report is an in-depth analysis detailing your home's value as well as a comparison with similar homes in the area
Home Values in the Area
Average Home Value in this Area
Purchase History
| Date | Buyer | Sale Price | Title Company |
|---|---|---|---|
| Fenicle Michael D | $300,000 | Fidelity National Title Insu | |
| Perkins John | $335,500 | Security Title | |
| Privett Arlan K | $231,548 | Land Title | |
| Fenicle Michael D | -- | -- |
Source: Public Records
Mortgage History
| Date | Status | Borrower | Loan Amount |
|---|---|---|---|
| Open | Fenicle Michael D | $240,000 | |
| Previous Owner | Perkins John | $175,800 | |
| Previous Owner | Privett Arlan K | $224,600 |
Source: Public Records
Tax History Compared to Growth
Tax History
| Year | Tax Paid | Tax Assessment Tax Assessment Total Assessment is a certain percentage of the fair market value that is determined by local assessors to be the total taxable value of land and additions on the property. | Land | Improvement |
|---|---|---|---|---|
| 2025 | $2,521 | $41,610 | -- | -- |
| 2024 | $2,496 | $42,940 | $6,700 | $36,240 |
| 2022 | $2,132 | $30,210 | $5,420 | $24,790 |
| 2021 | $2,358 | $31,080 | $5,580 | $25,500 |
| 2020 | $2,385 | $29,300 | $4,650 | $24,650 |
| 2019 | $2,361 | $29,300 | $4,650 | $24,650 |
| 2018 | $2,059 | $25,140 | $3,600 | $21,540 |
| 2017 | $2,052 | $25,140 | $3,600 | $21,540 |
| 2016 | $2,239 | $27,400 | $3,660 | $23,740 |
| 2015 | $2,235 | $27,400 | $3,660 | $23,740 |
| 2014 | $2,110 | $25,850 | $3,660 | $22,190 |
Source: Public Records
Map
Nearby Homes
- 4545 Bays Water Dr
- 4652 Kashmire Dr
- 4658 Kashmire Dr
- 4585 Kashmire Dr
- 4405 Kashmire Dr
- 9247 Prairie Clover Dr
- 3925 Zurich Dr
- 8674 Bellcove Cir
- 5019 Petrified Forest Trail
- 8845 Nantucket Ct
- 5071 Farris Creek Ct
- 9075 Bellcove Cir
- 8735 Quail Glen Dr
- 5064 Construct Point
- 4895 Preachers Hollow Trail
- 4940 Deviation Point
- The Denali Plan at The Townes at Cumbre Vista
- The Elbrus Plan at The Townes at Cumbre Vista
- The Vinson Plan at The Townes at Cumbre Vista
- The Everest Plan at The Townes at Cumbre Vista
- 9035 Musgrave St
- 9051 Musgrave St
- 4540 Bays Water Dr
- 4530 Bays Water Dr
- 9067 Musgrave St
- 9027 Musgrave St
- 4550 Bays Water Dr
- 9050 Musgrave St
- 9042 Musgrave St
- 4520 Bays Water Dr
- 9058 Musgrave St
- 9034 Musgrave St
- 9075 Musgrave St
- 9019 Musgrave St
- 9066 Musgrave St
- 9026 Musgrave St
- 4560 Bays Water Dr
- 4510 Bays Water Dr
- 9018 Musgrave St
- 9017 Musgrave St