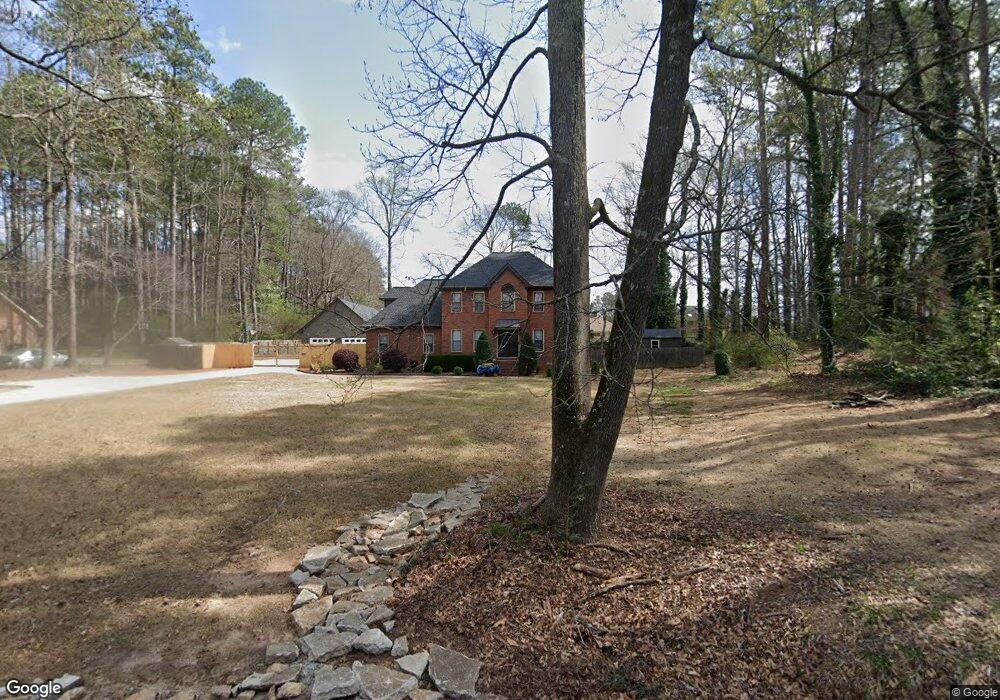
9044 Floyd Rd Jonesboro, GA 30236
Estimated Value: $369,000 - $405,000
3
Beds
3
Baths
2,404
Sq Ft
$158/Sq Ft
Est. Value
About This Home
This home is located at 9044 Floyd Rd, Jonesboro, GA 30236 and is currently estimated at $380,309, approximately $158 per square foot. 9044 Floyd Rd is a home located in Henry County with nearby schools including Suder Elementary School, M. D. Roberts Middle School, and Jonesboro High School.
Ownership History
Date
Name
Owned For
Owner Type
Purchase Details
Closed on
Aug 10, 2007
Sold by
Deutsche Bk Natl Trust Co
Bought by
Ross William M and Ross Dionca C
Current Estimated Value
Home Financials for this Owner
Home Financials are based on the most recent Mortgage that was taken out on this home.
Original Mortgage
$195,000
Outstanding Balance
$122,707
Interest Rate
6.63%
Mortgage Type
New Conventional
Estimated Equity
$257,602
Purchase Details
Closed on
Mar 6, 2007
Sold by
Voltaire Darlene
Bought by
Deutsche Bk Natl Trust Co
Purchase Details
Closed on
Aug 9, 2005
Sold by
Dobbs Virginia H
Bought by
Voltaire Darline
Home Financials for this Owner
Home Financials are based on the most recent Mortgage that was taken out on this home.
Original Mortgage
$212,415
Interest Rate
7.88%
Mortgage Type
New Conventional
Create a Home Valuation Report for This Property
The Home Valuation Report is an in-depth analysis detailing your home's value as well as a comparison with similar homes in the area
Home Values in the Area
Average Home Value in this Area
Purchase History
| Date | Buyer | Sale Price | Title Company |
|---|---|---|---|
| Ross William M | $195,000 | -- | |
| Deutsche Bk Natl Trust Co | $221,890 | -- | |
| Voltaire Darline | $125,000 | -- | |
| Voltaire Darline | $125,000 | -- |
Source: Public Records
Mortgage History
| Date | Status | Borrower | Loan Amount |
|---|---|---|---|
| Open | Ross William M | $195,000 | |
| Previous Owner | Voltaire Darline | $212,415 |
Source: Public Records
Tax History Compared to Growth
Tax History
| Year | Tax Paid | Tax Assessment Tax Assessment Total Assessment is a certain percentage of the fair market value that is determined by local assessors to be the total taxable value of land and additions on the property. | Land | Improvement |
|---|---|---|---|---|
| 2025 | $4,485 | $155,680 | $15,160 | $140,520 |
| 2024 | $4,485 | $145,040 | $13,680 | $131,360 |
| 2023 | $4,280 | $151,560 | $13,160 | $138,400 |
| 2022 | $3,797 | $111,200 | $12,160 | $99,040 |
| 2021 | $2,980 | $85,120 | $10,440 | $74,680 |
| 2020 | $2,735 | $77,320 | $9,800 | $67,520 |
| 2019 | $2,591 | $73,560 | $9,320 | $64,240 |
| 2018 | $2,967 | $84,160 | $8,600 | $75,560 |
| 2016 | $2,689 | $76,120 | $6,400 | $69,720 |
| 2015 | $2,738 | $75,520 | $7,200 | $68,320 |
| 2014 | $2,542 | $69,880 | $7,200 | $62,680 |
Source: Public Records
Map
Nearby Homes
- 0 S Bay Dr Unit 7644005
- 0 S Bay Dr Unit 10591885
- 3272 S Bay Dr
- 3258 S Bay Dr
- 707 Lexington Ave
- 3117 Jodeco Dr
- 2641 Jodeco Dr
- 3080 Jodeco Dr
- 3223 Rhonda Dr
- 210 Longwood Dr Unit 1
- 2669 Jodeco Dr
- 3194 Liverpool St
- 3027 Jodeco Dr
- 3024 Emerald Dr
- 1013 Columbus Dr
- 9055 Kelly Ct
- 440 Longwood Ct Unit 440
- 3003 Emerald Dr
- 3006 Emerald Dr
- 141 Amicalola Way
- 9030 Floyd Rd
- 9030 Floyd Rd
- 9058 Floyd Rd
- 212 Jamestown Ave
- 9041 Floyd Rd
- 210 Jamestown Ave
- 3288 Jodeco Dr
- 9072 Floyd Rd
- 9031 Floyd Rd
- 216 Jamestown Ave
- 9021 Floyd Rd
- 208 Jamestown Ave Unit 4 and 5
- 3272 Jodeco Dr
- 502 Cambridge Cir Unit 11
- 502 Cambridge Cir
- 9009 Floyd Rd
- 3285 Jodeco Dr
- 3264 Jodeco Dr
- 206 Jamestown Ave
- 206 Jamestown Ave Unit 4/D