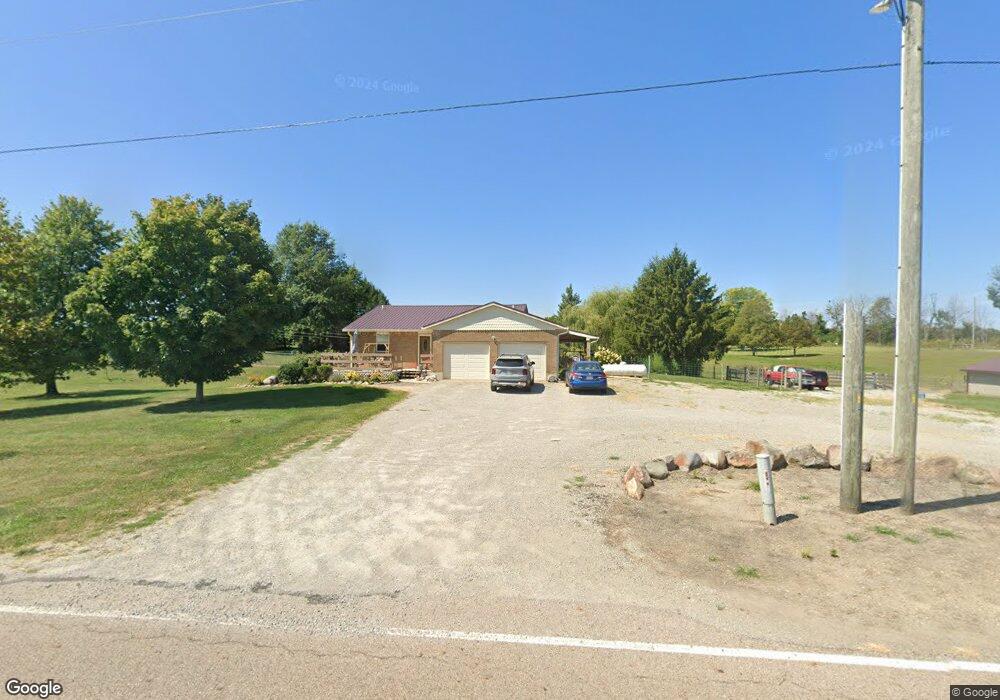
9045 Dillman Rd Camden, OH 45311
Estimated Value: $316,000 - $467,000
3
Beds
2
Baths
1,174
Sq Ft
$311/Sq Ft
Est. Value
About This Home
This home is located at 9045 Dillman Rd, Camden, OH 45311 and is currently estimated at $364,815, approximately $310 per square foot. 9045 Dillman Rd is a home located in Preble County with nearby schools including Preble Shawnee Elementary School, West Elkton Intermediate School, and Preble Shawnee Junior/Senior High School.
Ownership History
Date
Name
Owned For
Owner Type
Purchase Details
Closed on
Nov 7, 2022
Sold by
Colclasure Eric
Bought by
Colclasure Christina
Current Estimated Value
Purchase Details
Closed on
Apr 30, 2001
Sold by
Colclasure Jerry
Bought by
Colclasure Eric and Colclasure Christina
Home Financials for this Owner
Home Financials are based on the most recent Mortgage that was taken out on this home.
Original Mortgage
$123,200
Interest Rate
7.03%
Mortgage Type
New Conventional
Purchase Details
Closed on
Oct 1, 1984
Bought by
Colclasure Eric and Colclasure Christina
Create a Home Valuation Report for This Property
The Home Valuation Report is an in-depth analysis detailing your home's value as well as a comparison with similar homes in the area
Home Values in the Area
Average Home Value in this Area
Purchase History
| Date | Buyer | Sale Price | Title Company |
|---|---|---|---|
| Colclasure Christina | $166 | -- | |
| Colclasure Christina | $166 | None Listed On Document | |
| Colclasure Eric | $154,000 | -- | |
| Colclasure Eric | $17,300 | -- |
Source: Public Records
Mortgage History
| Date | Status | Borrower | Loan Amount |
|---|---|---|---|
| Previous Owner | Colclasure Eric | $123,200 |
Source: Public Records
Tax History Compared to Growth
Tax History
| Year | Tax Paid | Tax Assessment Tax Assessment Total Assessment is a certain percentage of the fair market value that is determined by local assessors to be the total taxable value of land and additions on the property. | Land | Improvement |
|---|---|---|---|---|
| 2024 | $3,295 | $90,480 | $22,230 | $68,250 |
| 2023 | $3,295 | $90,480 | $22,230 | $68,250 |
| 2022 | $2,595 | $67,140 | $20,970 | $46,170 |
| 2021 | $2,707 | $67,140 | $20,970 | $46,170 |
| 2020 | $2,577 | $67,140 | $20,970 | $46,170 |
| 2019 | $2,158 | $55,620 | $17,330 | $38,290 |
| 2018 | $2,287 | $55,620 | $17,330 | $38,290 |
| 2017 | $2,321 | $55,620 | $17,330 | $38,290 |
| 2016 | $2,017 | $54,670 | $16,800 | $37,870 |
| 2014 | $2,115 | $54,670 | $16,800 | $37,870 |
| 2013 | $2,355 | $57,680 | $16,800 | $40,880 |
Source: Public Records
Map
Nearby Homes
- 407 W Central Ave
- 388 W Hendricks St
- 131 S Lafayette St
- 0 Oxford Germantown Rd
- 471 Camden West Elkton Rd
- 1246 Oxford Germantown Rd
- 103 Katherine Ct
- 1222 Oxford Germantown Rd
- 679 Oxford Germantown Rd
- 725 Sr
- 105 Mill St
- 759 Barnetts Mill Rd
- 3355 Somerville Rd
- 314 Lakengren Dr
- 0 Valhalla Cove Unit 941078
- 0 Lars Cove Unit 1745954
- 6135 Jericho Ln
- 820 Lars Cove
- 817 Old Norse Dr
- 250 Lakengren Dr
- 8062 Pottenger Rd
- 8062 Pottenger Rd
- 9187 Dillman Rd
- 8100 Pottenger Rd
- 9191 Dillman Rd
- 9192 Pottenger Rd
- 9195 Dillman Rd
- 8713 Dillman Rd
- 9201 Dillman Rd
- 9218 Pottenger Rd
- 9221 Dillman Rd
- 9234 Pottenger Rd
- 9257 Dillman Rd
- 9257 Dillman Rd
- 9242 Pottenger Rd
- 9242 Pottenger Rd
- 8555 Dillman Rd
- 2393 Camden College Corner Rd
- 8576 Dillman Rd
- 2731 Camden College Corner Rd