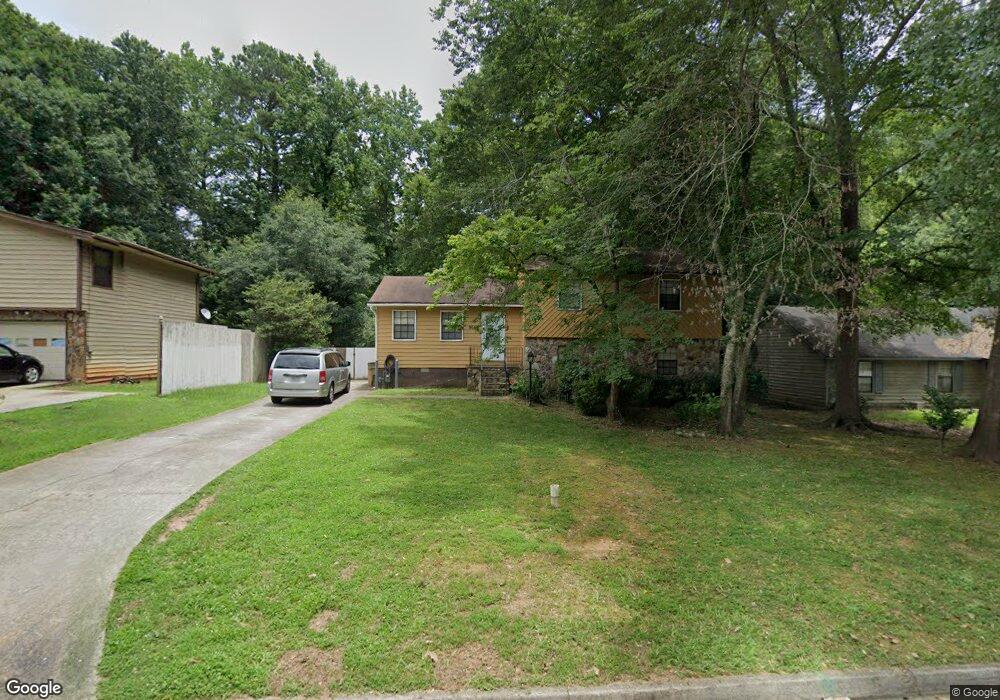
9046 Southcrest Ct Jonesboro, GA 30238
Estimated Value: $234,000 - $257,000
4
Beds
4
Baths
2,119
Sq Ft
$116/Sq Ft
Est. Value
About This Home
This home is located at 9046 Southcrest Ct, Jonesboro, GA 30238 and is currently estimated at $245,836, approximately $116 per square foot. 9046 Southcrest Ct is a home located in Clayton County with nearby schools including Swint Elementary School, Pointe South Middle School, and Mundy's Mill High School.
Ownership History
Date
Name
Owned For
Owner Type
Purchase Details
Closed on
May 20, 2022
Sold by
Divvy Homes Warehouse A Llc
Bought by
Mission Street Homes Llc
Current Estimated Value
Purchase Details
Closed on
Nov 5, 2020
Sold by
Quijada Nelson
Bought by
Divvy Homes Warehouse A Llc
Purchase Details
Closed on
Aug 7, 2020
Sold by
Omni Properties Llc
Bought by
Quijada Nelson
Home Financials for this Owner
Home Financials are based on the most recent Mortgage that was taken out on this home.
Original Mortgage
$75,000
Interest Rate
3.1%
Mortgage Type
New Conventional
Purchase Details
Closed on
Jul 17, 2020
Sold by
Coulter Michael
Bought by
Omni Properties Llc
Home Financials for this Owner
Home Financials are based on the most recent Mortgage that was taken out on this home.
Original Mortgage
$75,000
Interest Rate
3.1%
Mortgage Type
New Conventional
Create a Home Valuation Report for This Property
The Home Valuation Report is an in-depth analysis detailing your home's value as well as a comparison with similar homes in the area
Home Values in the Area
Average Home Value in this Area
Purchase History
| Date | Buyer | Sale Price | Title Company |
|---|---|---|---|
| Mission Street Homes Llc | -- | -- | |
| Divvy Homes Warehouse A Llc | $191,500 | -- | |
| Quijada Nelson | $110,000 | -- | |
| Omni Properties Llc | $75,000 | -- |
Source: Public Records
Mortgage History
| Date | Status | Borrower | Loan Amount |
|---|---|---|---|
| Previous Owner | Omni Properties Llc | $75,000 |
Source: Public Records
Tax History Compared to Growth
Tax History
| Year | Tax Paid | Tax Assessment Tax Assessment Total Assessment is a certain percentage of the fair market value that is determined by local assessors to be the total taxable value of land and additions on the property. | Land | Improvement |
|---|---|---|---|---|
| 2025 | $4,343 | $112,480 | $7,200 | $105,280 |
| 2024 | $3,343 | $84,800 | $7,200 | $77,600 |
| 2023 | $3,062 | $84,800 | $7,200 | $77,600 |
| 2022 | $3,363 | $84,800 | $7,200 | $77,600 |
| 2021 | $2,588 | $64,640 | $7,200 | $57,440 |
| 2020 | $1,758 | $43,086 | $7,200 | $35,886 |
| 2019 | $1,585 | $38,171 | $5,600 | $32,571 |
| 2018 | $1,468 | $35,294 | $5,600 | $29,694 |
| 2017 | $1,110 | $26,424 | $5,600 | $20,824 |
| 2016 | $1,022 | $24,264 | $5,600 | $18,664 |
| 2015 | $980 | $0 | $0 | $0 |
| 2014 | $1,084 | $27,257 | $5,600 | $21,657 |
Source: Public Records
Map
Nearby Homes
- 9103 Raven Dr
- 9043 Raven Dr
- 8988 Raven Dr
- 8949 Raven Dr Unit I
- 9138 Sunset Dr Unit 3
- 8865 Raven Dr
- 9181 Welch Ct
- 420 Cheri Place
- 616 Country Lane Dr
- 8882 Habersham Dr
- 444 Wellington Way
- 8896 Wellston Ct
- 529 Westminster Ln
- 638 Wellington Way
- 8862 Wesley Place
- 578 Wellington Way
- 8846 Wesley Place
- 9383 Woodknoll Way Unit 4
- 553 Wellington Way
- 9409 Forest Knoll Dr
- 9046 Southcrest Ct
- 9046 Southcrest Ct Unit 3
- 9038 Southcrest Ct
- 9050 Southcrest Ct
- 0 Southcrest Ct Unit 8826821
- 9059 Raven Dr
- 9030 Southcrest Ct
- 9063 Raven Dr
- 9054 Southcrest Ct
- 9055 Raven Dr Unit 2
- 9067 Raven Dr Unit 2
- 9049 Southcrest Ct Unit 3
- 734 Fieldstone Dr Unit 3
- 718 Fieldstone Dr Unit 3
- 718 Fieldstone Dr
- 9051 Raven Dr
- 9073 Raven Dr
- 9053 Southcrest Ct
- 9058 Southcrest Ct Unit 3
- 742 Fieldstone Dr Unit 3