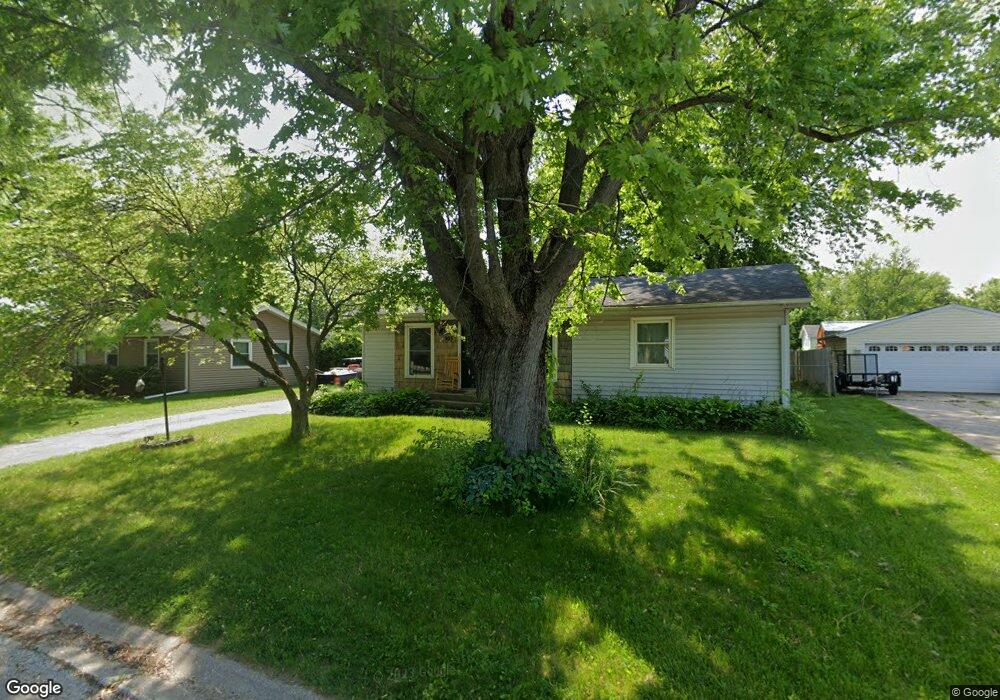
905 15th St Port Byron, IL 61275
Estimated Value: $141,000 - $196,000
Studio
--
Bath
1,008
Sq Ft
$165/Sq Ft
Est. Value
About This Home
This home is located at 905 15th St, Port Byron, IL 61275 and is currently estimated at $166,575, approximately $165 per square foot. 905 15th St is a home located in Rock Island County with nearby schools including Riverdale Elementary School, Riverdale Middle School, and Riverdale Senior High School.
Ownership History
Date
Name
Owned For
Owner Type
Purchase Details
Closed on
Dec 19, 2025
Sold by
Lechtenberg Leroy L
Bought by
Wilson Carl A
Current Estimated Value
Home Financials for this Owner
Home Financials are based on the most recent Mortgage that was taken out on this home.
Original Mortgage
$146,074
Outstanding Balance
$145,792
Interest Rate
6.17%
Mortgage Type
VA
Estimated Equity
$20,783
Purchase Details
Closed on
Sep 19, 2025
Sold by
Lechtenberg Leroy L and Wilson Candice D
Bought by
Lechtenberg Leroy L
Create a Home Valuation Report for This Property
The Home Valuation Report is an in-depth analysis detailing your home's value as well as a comparison with similar homes in the area
Home Values in the Area
Average Home Value in this Area
Purchase History
| Date | Buyer | Sale Price | Title Company |
|---|---|---|---|
| Wilson Carl A | $143,000 | None Listed On Document | |
| Lechtenberg Leroy L | -- | None Listed On Document |
Source: Public Records
Mortgage History
| Date | Status | Borrower | Loan Amount |
|---|---|---|---|
| Open | Wilson Carl A | $146,074 |
Source: Public Records
Tax History
| Year | Tax Paid | Tax Assessment Tax Assessment Total Assessment is a certain percentage of the fair market value that is determined by local assessors to be the total taxable value of land and additions on the property. | Land | Improvement |
|---|---|---|---|---|
| 2024 | $3,826 | $57,080 | $11,270 | $45,810 |
| 2023 | $3,826 | $53,495 | $10,562 | $42,933 |
| 2022 | $3,663 | $53,329 | $10,274 | $43,055 |
| 2021 | $3,584 | $50,984 | $9,822 | $41,162 |
| 2020 | $3,532 | $50,330 | $9,696 | $40,634 |
| 2019 | $3,475 | $49,416 | $9,520 | $39,896 |
| 2018 | $2,726 | $40,710 | $7,524 | $33,186 |
| 2017 | $2,629 | $39,951 | $7,384 | $32,567 |
| 2016 | $2,623 | $39,752 | $7,347 | $32,405 |
| 2015 | $2,587 | $38,973 | $7,203 | $31,770 |
| 2014 | -- | $37,997 | $7,023 | $30,974 |
| 2013 | -- | $37,997 | $7,023 | $30,974 |
Source: Public Records
Map
Nearby Homes
Your Personal Tour Guide
Ask me questions while you tour the home.