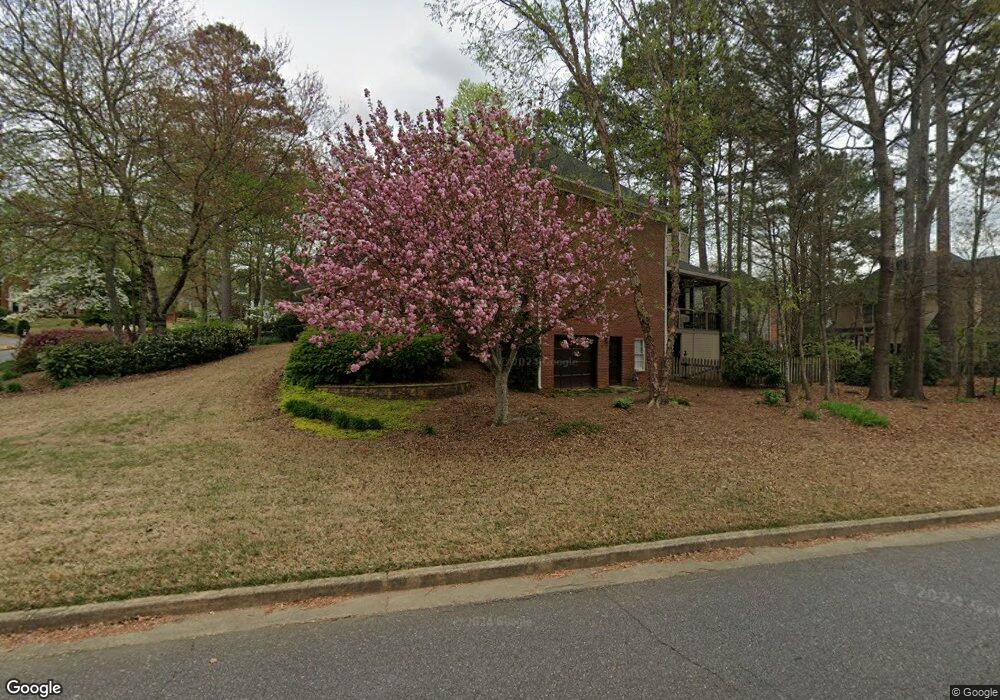
905 Cobblestone Ct Alpharetta, GA 30009
Estimated Value: $711,000 - $922,000
4
Beds
3
Baths
2,794
Sq Ft
$288/Sq Ft
Est. Value
About This Home
This home is located at 905 Cobblestone Ct, Alpharetta, GA 30009 and is currently estimated at $805,719, approximately $288 per square foot. 905 Cobblestone Ct is a home located in Fulton County with nearby schools including Alpharetta Elementary School, Northwestern Middle School, and Milton High School.
Ownership History
Date
Name
Owned For
Owner Type
Purchase Details
Closed on
Aug 8, 2005
Sold by
Edge Julian D
Bought by
Martin Donald C and Martin Lisa
Current Estimated Value
Home Financials for this Owner
Home Financials are based on the most recent Mortgage that was taken out on this home.
Original Mortgage
$508,572
Interest Rate
5.48%
Purchase Details
Closed on
Mar 15, 2000
Sold by
Thomas Cynthia
Bought by
Edge Julian D
Home Financials for this Owner
Home Financials are based on the most recent Mortgage that was taken out on this home.
Original Mortgage
$212,000
Interest Rate
8%
Mortgage Type
New Conventional
Purchase Details
Closed on
Dec 14, 1999
Sold by
Thomas David B
Bought by
Thomas Cynthia
Purchase Details
Closed on
Jan 31, 1997
Sold by
Thornton Lenox T
Bought by
Thomas David B
Create a Home Valuation Report for This Property
The Home Valuation Report is an in-depth analysis detailing your home's value as well as a comparison with similar homes in the area
Home Values in the Area
Average Home Value in this Area
Purchase History
| Date | Buyer | Sale Price | Title Company |
|---|---|---|---|
| Martin Donald C | $369,900 | -- | |
| Edge Julian D | $265,000 | -- | |
| Thomas Cynthia | -- | -- | |
| Thomas David B | $195,000 | -- |
Source: Public Records
Mortgage History
| Date | Status | Borrower | Loan Amount |
|---|---|---|---|
| Closed | Martin Donald C | $508,572 | |
| Previous Owner | Edge Julian D | $212,000 | |
| Closed | Thomas David B | $0 |
Source: Public Records
Tax History Compared to Growth
Tax History
| Year | Tax Paid | Tax Assessment Tax Assessment Total Assessment is a certain percentage of the fair market value that is determined by local assessors to be the total taxable value of land and additions on the property. | Land | Improvement |
|---|---|---|---|---|
| 2025 | $799 | $272,560 | $67,840 | $204,720 |
| 2023 | $6,653 | $235,720 | $54,840 | $180,880 |
| 2022 | $3,845 | $227,280 | $32,600 | $194,680 |
| 2021 | $4,476 | $160,000 | $26,760 | $133,240 |
| 2020 | $4,504 | $160,000 | $26,760 | $133,240 |
| 2019 | $659 | $186,000 | $26,760 | $159,240 |
| 2018 | $4,439 | $181,600 | $26,120 | $155,480 |
| 2017 | $3,747 | $140,360 | $28,680 | $111,680 |
| 2016 | $3,746 | $140,360 | $28,680 | $111,680 |
| 2015 | $4,368 | $140,360 | $28,680 | $111,680 |
| 2014 | $2,502 | $94,360 | $22,920 | $71,440 |
Source: Public Records
Map
Nearby Homes
- 1510 Shade Tree Way
- 1395 Mid Broadwell Rd
- 170 Michaela Dr
- 116 Emily Ln
- 3052 Steeplechase
- 3058 Steeplechase Unit 4
- 1530 Rucker Rd
- 1500 Mid Broadwell Rd
- 3018 Steeplechase
- 3016 Steeplechase Unit 3
- 1614 Rucker Rd
- 160 Watermill Falls
- 910 Reece Rd
- 1413 Bellsmith Dr
- Hillstone with Basement Plan at Emberly - Monarch Collection
- Rockmart Elite Plan at Emberly - Mariposa Collection
- Rockmart Plan at Emberly - Mariposa Collection
- Hedgewood with Basement Plan at Emberly - Monarch Collection
- Hedgewood Plan at Emberly - Monarch Collection
- 915 Cobblestone Ct
- 800 Smoke House Ct
- 810 Smoke House Ct
- 2250 Fairfax Dr
- 900 Cobblestone Ct
- 0 Cobblestone Ct Unit 7004894
- 0 Cobblestone Ct Unit 8335253
- 0 Cobblestone Ct Unit 8092833
- 2240 Fairfax Dr
- 925 Cobblestone Ct
- 910 Cobblestone Ct
- 820 Smoke House Ct
- 2230 Fairfax Dr
- 2260 Fairfax Dr
- 1475 Shade Tree Way
- 801 Smoke House Ct
- 1445 Shade Tree Way
- 920 Cobblestone Ct
- 2220 Fairfax Dr
- 830 Smoke House Ct