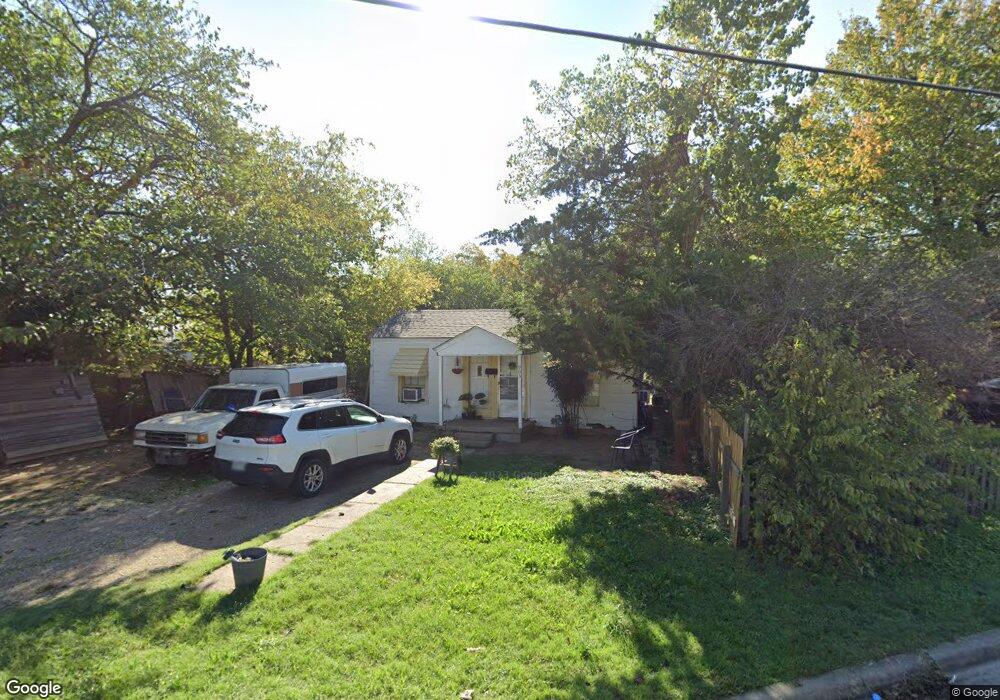
905 Davis St Grand Prairie, TX 75050
Estimated Value: $160,143 - $233,000
2
Beds
1
Bath
616
Sq Ft
$325/Sq Ft
Est. Value
About This Home
This home is located at 905 Davis St, Grand Prairie, TX 75050 and is currently estimated at $200,036, approximately $324 per square foot. 905 Davis St is a home located in Dallas County with nearby schools including Crosswinds High School, Delmas Morton Elementary School, and James Fannin Middle.
Ownership History
Date
Name
Owned For
Owner Type
Purchase Details
Closed on
Feb 4, 1998
Sold by
Business Strategies Inc
Bought by
Flores Daniel Soto and Flores Maria
Current Estimated Value
Home Financials for this Owner
Home Financials are based on the most recent Mortgage that was taken out on this home.
Original Mortgage
$39,500
Outstanding Balance
$7,042
Interest Rate
7.08%
Mortgage Type
Seller Take Back
Estimated Equity
$192,994
Create a Home Valuation Report for This Property
The Home Valuation Report is an in-depth analysis detailing your home's value as well as a comparison with similar homes in the area
Home Values in the Area
Average Home Value in this Area
Purchase History
| Date | Buyer | Sale Price | Title Company |
|---|---|---|---|
| Flores Daniel Soto | -- | -- |
Source: Public Records
Mortgage History
| Date | Status | Borrower | Loan Amount |
|---|---|---|---|
| Open | Flores Daniel Soto | $39,500 |
Source: Public Records
Tax History Compared to Growth
Tax History
| Year | Tax Paid | Tax Assessment Tax Assessment Total Assessment is a certain percentage of the fair market value that is determined by local assessors to be the total taxable value of land and additions on the property. | Land | Improvement |
|---|---|---|---|---|
| 2025 | $1,326 | $155,280 | $67,500 | $87,780 |
| 2024 | $1,326 | $149,430 | $67,500 | $81,930 |
| 2023 | $1,326 | $131,680 | $40,000 | $91,680 |
| 2022 | $2,234 | $88,050 | $40,000 | $48,050 |
| 2021 | $1,901 | $71,520 | $30,710 | $40,810 |
| 2020 | $1,955 | $69,330 | $30,710 | $38,620 |
| 2019 | $1,829 | $62,590 | $30,710 | $31,880 |
| 2018 | $1,642 | $56,190 | $30,710 | $25,480 |
| 2017 | $1,641 | $56,190 | $30,710 | $25,480 |
| 2016 | $1,459 | $49,960 | $30,710 | $19,250 |
| 2015 | $456 | $48,280 | $30,710 | $17,570 |
| 2014 | $456 | $47,940 | $30,710 | $17,230 |
Source: Public Records
Map
Nearby Homes