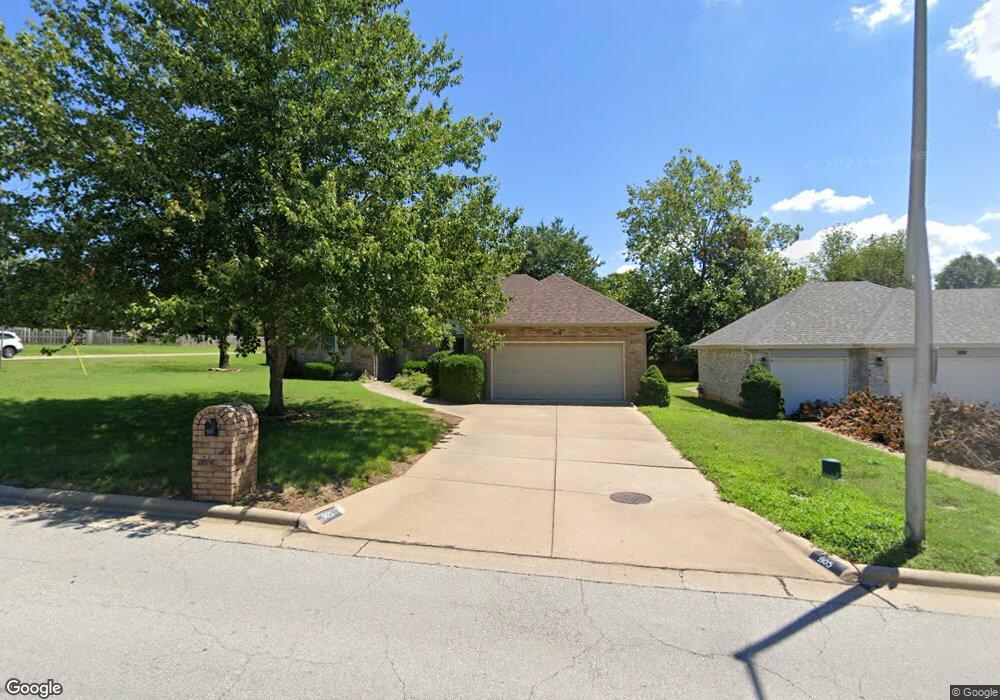
905 E National Place Blvd Springfield, MO 65810
Southside NeighborhoodEstimated Value: $300,792 - $379,000
3
Beds
2
Baths
1,710
Sq Ft
$197/Sq Ft
Est. Value
About This Home
This home is located at 905 E National Place Blvd, Springfield, MO 65810 and is currently estimated at $337,198, approximately $197 per square foot. 905 E National Place Blvd is a home located in Greene County with nearby schools including Walt Disney Elementary School, Cherokee Middle School, and Kickapoo High School.
Ownership History
Date
Name
Owned For
Owner Type
Purchase Details
Closed on
Feb 7, 2025
Sold by
Pinkston Shane
Bought by
Pinkston Alan and Pinkston Robin
Current Estimated Value
Purchase Details
Closed on
Jun 27, 2024
Sold by
Pinkston Shirley Kay
Bought by
Pinkston Shane
Purchase Details
Closed on
Nov 23, 2011
Sold by
Pinkston Shirley Kay and Sliger Deanna Mae
Bought by
Pinkston Shirley Kay
Purchase Details
Closed on
Jan 6, 2011
Sold by
Craven Ca
Bought by
Sligar Deanna Mae
Purchase Details
Closed on
Jan 3, 2011
Sold by
Craven C A and Craven Julia B
Bought by
Sliger Deanna Mae
Purchase Details
Closed on
Dec 29, 2010
Sold by
Craven C A
Bought by
Garrett Caroly Sue
Purchase Details
Closed on
Jan 3, 2010
Sold by
Craven C A
Bought by
Pinkston Shirley Kay
Create a Home Valuation Report for This Property
The Home Valuation Report is an in-depth analysis detailing your home's value as well as a comparison with similar homes in the area
Home Values in the Area
Average Home Value in this Area
Purchase History
We collect this data history from publicly available records. To have your information removed, we recommend requesting removal directly through your county’s website.
| Date | Buyer | Sale Price | Title Company |
|---|---|---|---|
| Pinkston Alan | -- | None Listed On Document | |
| Pinkston Alan | -- | None Listed On Document | |
| Pinkston Shane | -- | None Listed On Document | |
| Pinkston Shirley Kay | -- | Lincoln Land Title | |
| Sligar Deanna Mae | -- | None Available | |
| Sliger Deanna Mae | -- | None Available | |
| Garrett Carolyn Sue | -- | None Available | |
| Garrett Caroly Sue | -- | None Available | |
| Sligar Deanna Mae | -- | None Available | |
| Pinkston Shirley Kay | -- | None Available | |
| Garrett Carolyn Sue | -- | None Available | |
| Sliger Deanna Mae | -- | None Available | |
| Pinkston Shirley Kay | -- | None Available |
Source: Public Records
Tax History
| Year | Tax Paid | Tax Assessment Tax Assessment Total Assessment is a certain percentage of the fair market value that is determined by local assessors to be the total taxable value of land and additions on the property. | Land | Improvement |
|---|---|---|---|---|
| 2025 | $1,999 | $40,130 | $6,270 | $33,860 |
| 2024 | $1,884 | $35,110 | $5,700 | $29,410 |
| 2023 | $1,873 | $35,110 | $5,700 | $29,410 |
| 2022 | $1,672 | $30,610 | $5,700 | $24,910 |
| 2021 | $1,672 | $30,610 | $5,700 | $24,910 |
| 2020 | $1,693 | $29,640 | $5,700 | $23,940 |
| 2019 | $1,645 | $29,640 | $5,700 | $23,940 |
| 2018 | $1,481 | $26,700 | $5,700 | $21,000 |
| 2017 | $1,466 | $26,140 | $5,700 | $20,440 |
| 2016 | $1,433 | $26,140 | $5,700 | $20,440 |
| 2015 | $1,420 | $26,140 | $5,700 | $20,440 |
| 2014 | $1,383 | $25,290 | $5,700 | $19,590 |
Source: Public Records
Map
Nearby Homes
- 5109 S Winslow Ct
- 930 E Canterbury St
- 5252 S Holland Ave
- 879 E Westchester Dr
- 4616 S Holland Ave
- 378 E Degraffenreid St
- 329 E Lafayette St
- 377 E Degraffenreid St
- 680 E Trakel Place
- 1264 E Lafayette Ct
- 1221 E Knobhill St
- 319 E Farm Road 182
- 4921 S Aaron Ave
- 5996 S Holland Ave
- 5411 S Jefferson Ave
- Lots 17 S Clay Ave
- Lots 16 S Clay Ave
- 1226 E Highpoint St
- 1360 E Lafayette St
- 1317 E Highpoint St
- 915 E National Place Blvd
- 5031 S Virginia Ct
- 5021 S Virginia Ct
- 945 E National Place Blvd
- 910 E National Place Blvd
- 4929 S Ashford Ave
- 5041 S Virginia Ct
- 920 E National Place Blvd
- 4930 S Ashford Ave
- 930 E National Place Blvd
- 832 E Carleton St
- 5051 S Virginia Ct
- 4921 S Ashford Ave
- 940 E National Place Blvd
- 5020 S Virginia Ct
- 824 E Carleton St
- 4922 S Ashford Ave
- 946 E National Place Blvd
- 5030 S Virginia Ct
- 5040 S Virginia Ct
Your Personal Tour Guide
Ask me questions while you tour the home.