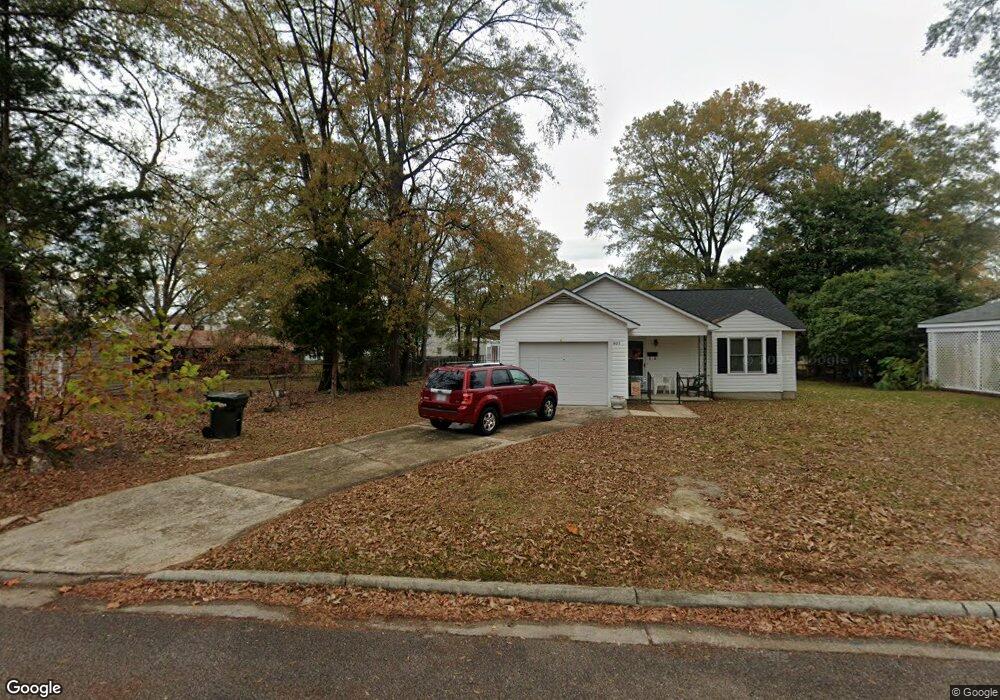
905 Faison St E Wilson, NC 27893
Estimated Value: $144,000 - $186,880
3
Beds
2
Baths
1,210
Sq Ft
$136/Sq Ft
Est. Value
About This Home
This home is located at 905 Faison St E, Wilson, NC 27893 and is currently estimated at $163,970, approximately $135 per square foot. 905 Faison St E is a home located in Wilson County with nearby schools including Vick Elementary School, Toisnot Middle School, and Fike High School.
Ownership History
Date
Name
Owned For
Owner Type
Purchase Details
Closed on
Jun 23, 2020
Sold by
Farmer Keith B and Farmer Lisa Diane
Bought by
Farmer Keith B and Farmer Lisa Diane
Current Estimated Value
Home Financials for this Owner
Home Financials are based on the most recent Mortgage that was taken out on this home.
Original Mortgage
$78,500
Outstanding Balance
$55,059
Interest Rate
3.1%
Mortgage Type
New Conventional
Estimated Equity
$108,911
Purchase Details
Closed on
Jul 25, 2007
Sold by
Farmer Denise A
Bought by
Farmer Keith B
Purchase Details
Closed on
Nov 13, 2006
Sold by
Farmer Terrence and Farmer Suzette
Bought by
Farmer Keith B
Home Financials for this Owner
Home Financials are based on the most recent Mortgage that was taken out on this home.
Original Mortgage
$72,250
Interest Rate
6.31%
Mortgage Type
New Conventional
Create a Home Valuation Report for This Property
The Home Valuation Report is an in-depth analysis detailing your home's value as well as a comparison with similar homes in the area
Home Values in the Area
Average Home Value in this Area
Purchase History
| Date | Buyer | Sale Price | Title Company |
|---|---|---|---|
| Farmer Keith B | -- | None Available | |
| Farmer Keith B | -- | None Available | |
| Farmer Keith B | $85,000 | None Available |
Source: Public Records
Mortgage History
| Date | Status | Borrower | Loan Amount |
|---|---|---|---|
| Open | Farmer Keith B | $78,500 | |
| Closed | Farmer Keith B | $72,250 |
Source: Public Records
Tax History
| Year | Tax Paid | Tax Assessment Tax Assessment Total Assessment is a certain percentage of the fair market value that is determined by local assessors to be the total taxable value of land and additions on the property. | Land | Improvement |
|---|---|---|---|---|
| 2025 | $1,921 | $171,511 | $15,000 | $156,511 |
| 2024 | $1,921 | $171,511 | $15,000 | $156,511 |
| 2023 | $1,248 | $95,631 | $12,000 | $83,631 |
| 2022 | $1,248 | $95,631 | $12,000 | $83,631 |
| 2021 | $1,248 | $95,631 | $12,000 | $83,631 |
| 2020 | $1,248 | $95,631 | $12,000 | $83,631 |
| 2019 | $1,248 | $95,631 | $12,000 | $83,631 |
| 2018 | $1,248 | $95,631 | $12,000 | $83,631 |
| 2017 | $1,229 | $95,631 | $12,000 | $83,631 |
| 2016 | $1,229 | $95,631 | $12,000 | $83,631 |
| 2014 | $1,272 | $102,151 | $12,000 | $90,151 |
Source: Public Records
Map
Nearby Homes
- 804 Vance St E
- 900 Viola St E
- 5004 Ward Blvd
- 1300 Marlow St E
- 1110 Vance St E
- 631 Vance St E
- 405 Vick St E
- 303 Elba St E
- 628 Viola St E
- 615 Crowell St E
- 304 Reid St E
- 1321 Carolina St E
- 5314 Ward Blvd
- 909 Atlantic St E
- 1113 Nash St E
- 700 Us Highway 301 E
- 505 Green St E
- 511 Herring Ave NE
- 1310 Nash St SE
- 106 Ash St E
- 909 Faison St E
- 802 Reid St E
- 800 Reid St E
- 804 Reid St E
- 906 Faison St E
- 709 Carroll St E
- 902 Faison St E
- 900 Faison St E
- 1001 Faison St E
- 804 Carroll St E
- 702 Reid St E
- 1003 Faison St E
- 907 Vance St E
- 1000 Faison St E
- 905 Vance St E
- 909 Vance St E
- 903 Vance St E
- 913 Vance St E
- 1005 Faison St E
- 901 Vance St E
Your Personal Tour Guide
Ask me questions while you tour the home.