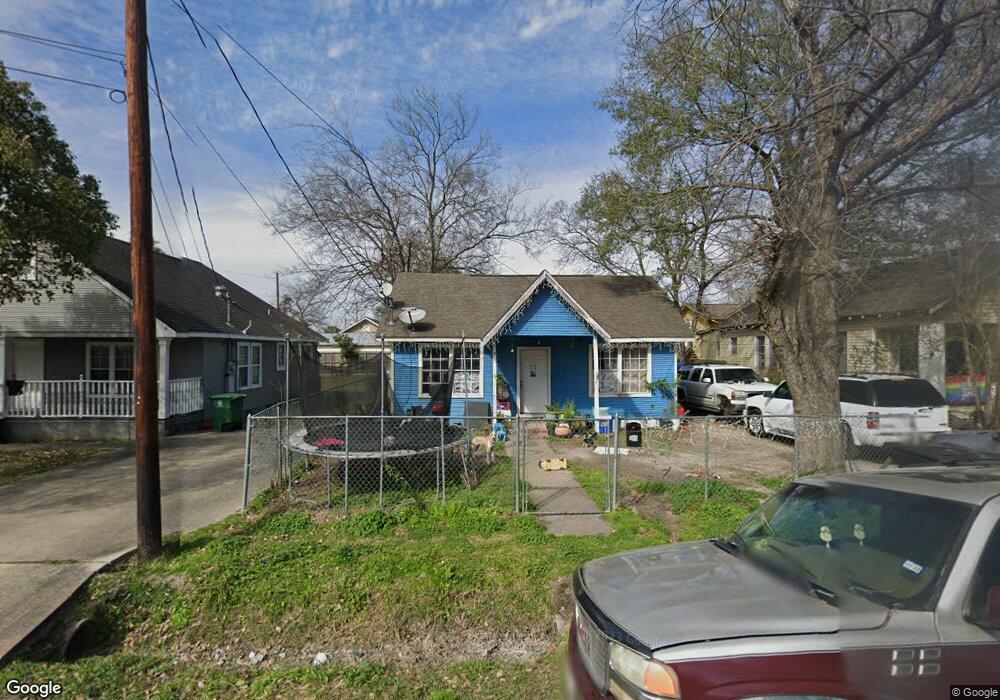
905 King St Houston, TX 77022
Northside-Northline NeighborhoodEstimated Value: $218,610 - $312,000
3
Beds
2
Baths
784
Sq Ft
$342/Sq Ft
Est. Value
About This Home
This home is located at 905 King St, Houston, TX 77022 and is currently estimated at $267,903, approximately $341 per square foot. 905 King St is a home located in Harris County with nearby schools including Roosevelt Elementary School, Burbank Middle School, and Northside High School.
Ownership History
Date
Name
Owned For
Owner Type
Purchase Details
Closed on
Dec 29, 2022
Sold by
Alvarado Gonzalo T
Bought by
Alvarado Gonzalo T and Alvarado Maria Teresa
Current Estimated Value
Purchase Details
Closed on
Feb 16, 2011
Sold by
Deleon Jaime and De Leon Hermelinda G
Bought by
Alvarado Gonzalo T
Purchase Details
Closed on
Nov 3, 1994
Sold by
Matta Rebecca Alva
Bought by
Deleon Jaime and Deleon Hermelinda G
Home Financials for this Owner
Home Financials are based on the most recent Mortgage that was taken out on this home.
Original Mortgage
$22,000
Interest Rate
8.78%
Mortgage Type
Seller Take Back
Create a Home Valuation Report for This Property
The Home Valuation Report is an in-depth analysis detailing your home's value as well as a comparison with similar homes in the area
Home Values in the Area
Average Home Value in this Area
Purchase History
| Date | Buyer | Sale Price | Title Company |
|---|---|---|---|
| Alvarado Gonzalo T | -- | -- | |
| Alvarado Gonzalo T | -- | First American Title | |
| Deleon Jaime | -- | American Title Company |
Source: Public Records
Mortgage History
| Date | Status | Borrower | Loan Amount |
|---|---|---|---|
| Previous Owner | Deleon Jaime | $22,000 |
Source: Public Records
Tax History Compared to Growth
Tax History
| Year | Tax Paid | Tax Assessment Tax Assessment Total Assessment is a certain percentage of the fair market value that is determined by local assessors to be the total taxable value of land and additions on the property. | Land | Improvement |
|---|---|---|---|---|
| 2025 | $3,375 | $153,979 | $108,000 | $45,979 |
| 2024 | $3,375 | $161,294 | $54,000 | $107,294 |
| 2023 | $3,375 | $161,294 | $54,000 | $107,294 |
| 2022 | $2,998 | $136,172 | $54,000 | $82,172 |
| 2021 | $2,564 | $110,000 | $54,000 | $56,000 |
| 2020 | $2,664 | $110,000 | $54,000 | $56,000 |
| 2019 | $2,783 | $115,942 | $54,000 | $61,942 |
| 2018 | $1,999 | $79,000 | $54,000 | $25,000 |
| 2017 | $1,998 | $79,000 | $54,000 | $25,000 |
| 2016 | $2,522 | $99,743 | $54,000 | $45,743 |
| 2015 | $1,599 | $75,680 | $28,350 | $47,330 |
| 2014 | $1,599 | $62,187 | $28,350 | $33,837 |
Source: Public Records
Map
Nearby Homes