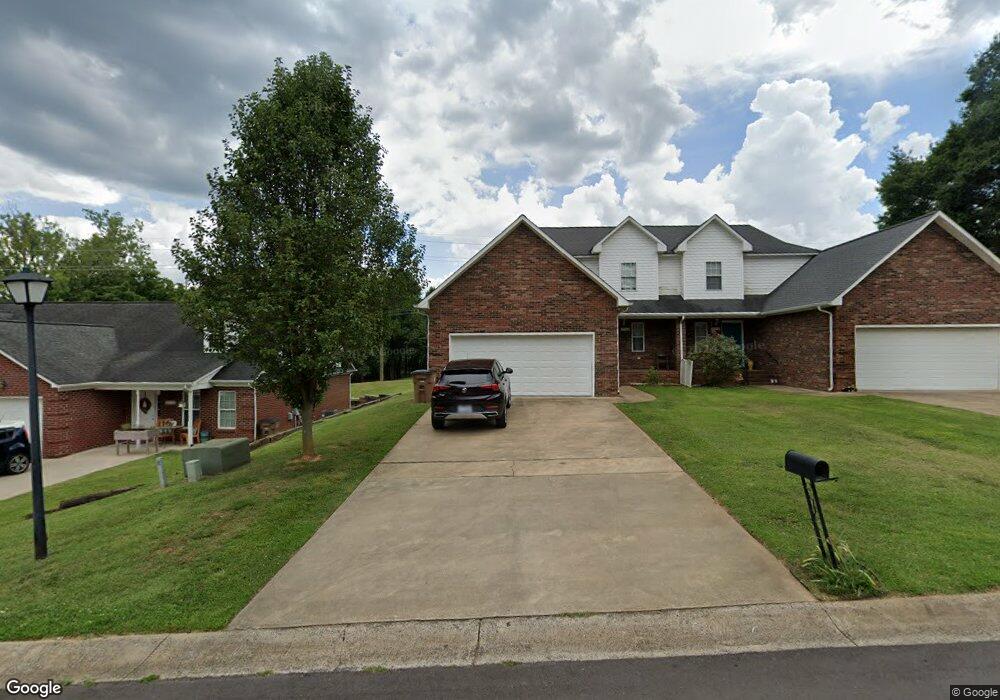
905 Linney Ln Unit B Shelby, NC 28152
Estimated Value: $259,000 - $361,000
3
Beds
3
Baths
1,539
Sq Ft
$194/Sq Ft
Est. Value
About This Home
This home is located at 905 Linney Ln Unit B, Shelby, NC 28152 and is currently estimated at $298,497, approximately $193 per square foot. 905 Linney Ln Unit B is a home located in Cleveland County with nearby schools including Graham Elementary School, James Love Elementary School, and Shelby Middle School.
Ownership History
Date
Name
Owned For
Owner Type
Purchase Details
Closed on
Sep 1, 2022
Sold by
Webber Nelsa L
Bought by
Whisnant Amanda and Whisnant Blake
Current Estimated Value
Home Financials for this Owner
Home Financials are based on the most recent Mortgage that was taken out on this home.
Original Mortgage
$256,500
Outstanding Balance
$245,614
Interest Rate
5.54%
Mortgage Type
New Conventional
Estimated Equity
$52,883
Purchase Details
Closed on
Dec 10, 2020
Sold by
Moon Cynthia R and Moon Wallace S
Bought by
Webber Nelsa L
Home Financials for this Owner
Home Financials are based on the most recent Mortgage that was taken out on this home.
Original Mortgage
$173,900
Interest Rate
4.37%
Mortgage Type
New Conventional
Purchase Details
Closed on
Aug 10, 2016
Sold by
Feemster Cynthia R
Bought by
Quicken Loans Inc
Purchase Details
Closed on
May 6, 2016
Sold by
Feemster Charles E and Feemster Cynthia R
Bought by
Feemster Cynthia R
Create a Home Valuation Report for This Property
The Home Valuation Report is an in-depth analysis detailing your home's value as well as a comparison with similar homes in the area
Home Values in the Area
Average Home Value in this Area
Purchase History
| Date | Buyer | Sale Price | Title Company |
|---|---|---|---|
| Whisnant Amanda | $270,000 | -- | |
| Webber Nelsa L | $174,000 | None Available | |
| Quicken Loans Inc | -- | None Available | |
| Feemster Cynthia R | -- | None Available |
Source: Public Records
Mortgage History
| Date | Status | Borrower | Loan Amount |
|---|---|---|---|
| Open | Whisnant Amanda | $256,500 | |
| Previous Owner | Webber Nelsa L | $173,900 |
Source: Public Records
Tax History Compared to Growth
Tax History
| Year | Tax Paid | Tax Assessment Tax Assessment Total Assessment is a certain percentage of the fair market value that is determined by local assessors to be the total taxable value of land and additions on the property. | Land | Improvement |
|---|---|---|---|---|
| 2025 | $2,626 | $263,944 | $25,000 | $238,944 |
| 2024 | $2,054 | $168,384 | $9,141 | $159,243 |
| 2023 | $1,978 | $162,885 | $9,141 | $153,744 |
| 2022 | $1,978 | $162,885 | $9,141 | $153,744 |
| 2021 | $1,988 | $162,885 | $9,141 | $153,744 |
| 2020 | $1,747 | $138,804 | $9,141 | $129,663 |
| 2019 | $1,747 | $138,804 | $9,141 | $129,663 |
| 2018 | $1,745 | $138,804 | $9,141 | $129,663 |
| 2017 | $1,702 | $138,804 | $9,141 | $129,663 |
| 2016 | $1,708 | $138,804 | $9,141 | $129,663 |
| 2015 | $1,789 | $153,315 | $9,141 | $144,174 |
| 2014 | $1,789 | $153,315 | $9,141 | $144,174 |
Source: Public Records
Map
Nearby Homes
- 905 Linney Ln Unit 35
- 905 Linney Ln
- 905 Linney Ln Unit A
- 903 Linney Ln Unit A
- 903 Linney Ln Unit A
- 903 Linney Ln
- 609 Leander St
- 611 Leander St
- 906 Linney Ln
- 613 Leander St
- 904 Linney Ln Unit 36
- 904 Linney Ln Unit A
- 904B Linney Ln
- 607 Leander St
- 615 Leander St
- 902 Linney Ln Unit B
- 902 Linney Ln Unit A
- 902b Linney Ln
- 605 Leander St
- 610 Leander St