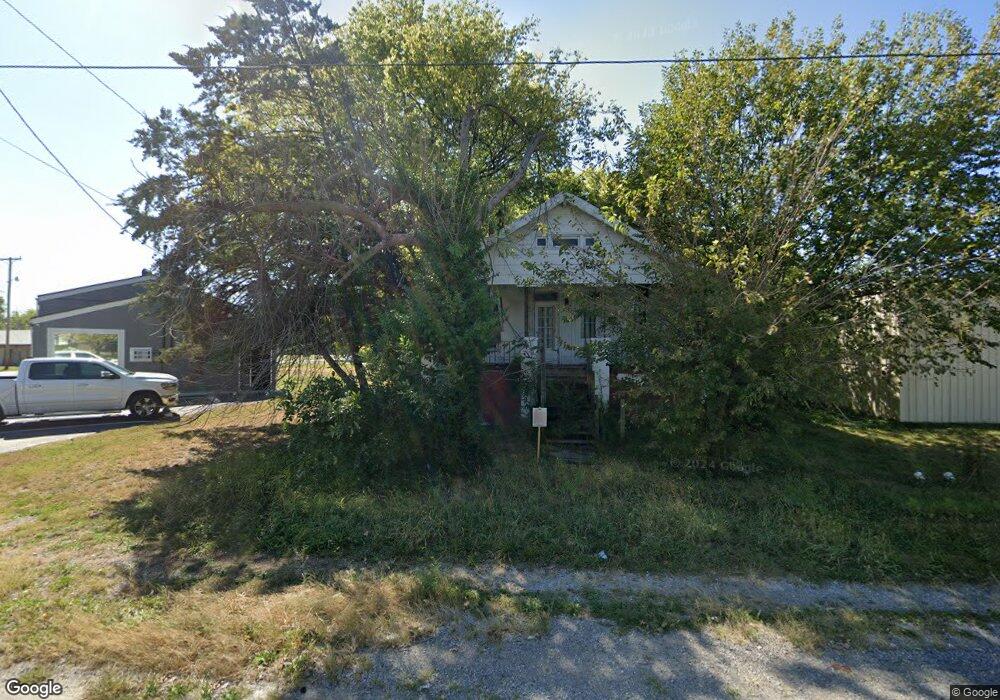
905 N Main St Harrisburg, IL 62946
Estimated Value: $57,408
2
Beds
1
Bath
1,316
Sq Ft
$44/Sq Ft
Est. Value
About This Home
This home is located at 905 N Main St, Harrisburg, IL 62946 and is currently priced at $57,408, approximately $43 per square foot. 905 N Main St is a home located in Saline County with nearby schools including East Side Intermediate School, Harrisburg Middle School, and Harrisburg High School.
Ownership History
Date
Name
Owned For
Owner Type
Purchase Details
Closed on
Jul 22, 2025
Sold by
Jenkins Gavin
Bought by
Jenkins Matthew J
Current Estimated Value
Purchase Details
Closed on
Nov 12, 2024
Sold by
City Of Harrisburg
Bought by
Jenkins Gavin
Purchase Details
Closed on
Jan 25, 2024
Sold by
Saline County
Bought by
City Of Harrisburg
Purchase Details
Closed on
Oct 12, 2023
Sold by
Saline County
Bought by
Saline County
Purchase Details
Closed on
Oct 11, 2017
Sold by
Bauer James P and Bard David Orr
Bought by
Bard Robert O
Purchase Details
Closed on
Sep 15, 2017
Sold by
Bauer Karl W and Bard David Orr
Bought by
Bard Robert O
Purchase Details
Closed on
Nov 22, 2016
Sold by
Bard Susan M and Bard Mclaughlin Elizabeth A
Bought by
Bard Robert O
Purchase Details
Closed on
Nov 2, 2007
Sold by
Clark Wilma J and Earl Clark C
Bought by
Bard David O and Bard Faye A
Create a Home Valuation Report for This Property
The Home Valuation Report is an in-depth analysis detailing your home's value as well as a comparison with similar homes in the area
Home Values in the Area
Average Home Value in this Area
Purchase History
| Date | Buyer | Sale Price | Title Company |
|---|---|---|---|
| Jenkins Matthew J | -- | None Listed On Document | |
| Jenkins Gavin | $550 | None Listed On Document | |
| City Of Harrisburg | -- | None Listed On Document | |
| City Of Harrisburg | -- | None Listed On Document | |
| Saline County | -- | None Listed On Document | |
| Saline County | -- | None Listed On Document | |
| Bard Robert O | -- | None Available | |
| Bard Robert O | -- | None Available | |
| Bard Robert O | -- | None Available | |
| Bard David O | -- | None Available |
Source: Public Records
Tax History Compared to Growth
Tax History
| Year | Tax Paid | Tax Assessment Tax Assessment Total Assessment is a certain percentage of the fair market value that is determined by local assessors to be the total taxable value of land and additions on the property. | Land | Improvement |
|---|---|---|---|---|
| 2024 | -- | $0 | $0 | $0 |
| 2023 | -- | $0 | $0 | $0 |
| 2022 | $1,025 | $9,925 | $1,290 | $8,635 |
| 2021 | $1,061 | $10,232 | $1,330 | $8,902 |
| 2020 | $1,049 | $9,925 | $1,290 | $8,635 |
| 2019 | $1,069 | $9,925 | $1,290 | $8,635 |
| 2018 | $1,080 | $9,925 | $1,290 | $8,635 |
| 2017 | $969 | $9,925 | $1,290 | $8,635 |
| 2016 | $0 | $9,925 | $1,290 | $8,635 |
| 2015 | -- | $9,925 | $1,290 | $8,635 |
| 2014 | $94 | $9,925 | $1,290 | $8,635 |
| 2013 | $94 | $9,925 | $1,290 | $8,635 |
| 2012 | $94 | $9,925 | $1,290 | $8,635 |
Source: Public Records
Map
Nearby Homes
- 111 W Midkiff St
- 202 W Poplar St
- 0 Ron Crank Dr Unit EB441387
- 216 W Poplar St
- 311 W Poplar St
- 204 N Sherman St
- 18 S Mill St
- 305 W Church St
- 430 W Church St
- 215 S Jackson St
- 210 W Lincoln St
- 504 W South St
- 305 W Lincoln St
- 630 N Commercial St
- 1120 Dorris Heights Rd
- 206 W Homer Ave
- 127 W Homer Ave
- 333 E Sloan St
- 520 S Mckinley St
- 200 Ogara St