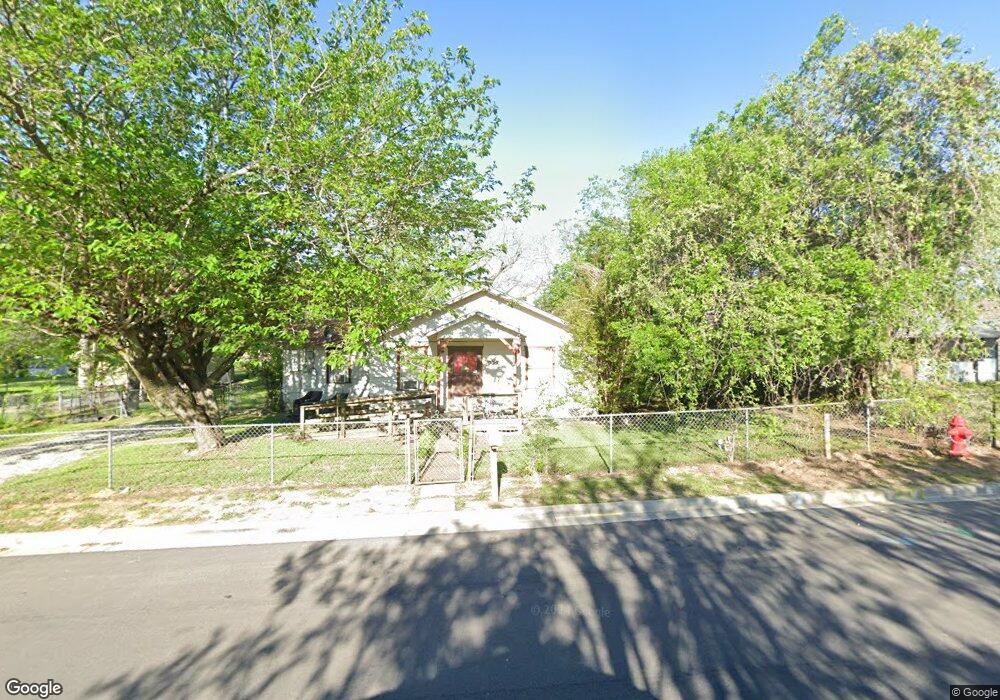
905 N Rusk St Weatherford, TX 76086
Estimated Value: $184,481 - $259,000
--
Bed
--
Bath
1,073
Sq Ft
$205/Sq Ft
Est. Value
About This Home
This home is located at 905 N Rusk St, Weatherford, TX 76086 and is currently estimated at $220,370, approximately $205 per square foot. 905 N Rusk St is a home located in Parker County with nearby schools including Seguin Elementary School, Tison Middle School, and Weatherford High School.
Ownership History
Date
Name
Owned For
Owner Type
Purchase Details
Closed on
Mar 2, 2022
Sold by
A-905 N Rusk St Land Trust
Bought by
Mclemore Felix C
Current Estimated Value
Purchase Details
Closed on
Jun 1, 2018
Sold by
Mclemore Felix Cornelious
Bought by
A 905 N Rusk Land Trust
Purchase Details
Closed on
Apr 13, 1993
Bought by
Mclemore Felix Cornelious
Purchase Details
Closed on
Feb 27, 1989
Bought by
Mclemore Felix Cornelious
Create a Home Valuation Report for This Property
The Home Valuation Report is an in-depth analysis detailing your home's value as well as a comparison with similar homes in the area
Home Values in the Area
Average Home Value in this Area
Purchase History
| Date | Buyer | Sale Price | Title Company |
|---|---|---|---|
| Mclemore Felix C | -- | None Listed On Document | |
| A 905 N Rusk Land Trust | -- | None Available | |
| Mclemore Felix Cornelious | -- | -- | |
| Mclemore Felix Cornelious | -- | -- |
Source: Public Records
Tax History Compared to Growth
Tax History
| Year | Tax Paid | Tax Assessment Tax Assessment Total Assessment is a certain percentage of the fair market value that is determined by local assessors to be the total taxable value of land and additions on the property. | Land | Improvement |
|---|---|---|---|---|
| 2025 | $3,192 | $182,580 | $50,000 | $132,580 |
| 2024 | $3,192 | $165,620 | $40,000 | $125,620 |
| 2023 | $3,192 | $165,620 | $40,000 | $125,620 |
| 2022 | $1,835 | $82,710 | $15,000 | $67,710 |
| 2021 | $1,986 | $82,710 | $15,000 | $67,710 |
| 2020 | $1,769 | $73,220 | $15,000 | $58,220 |
| 2019 | $1,870 | $73,220 | $15,000 | $58,220 |
| 2018 | $1,655 | $64,540 | $15,000 | $49,540 |
| 2017 | $1,698 | $64,540 | $15,000 | $49,540 |
| 2016 | $1,418 | $53,890 | $15,000 | $38,890 |
| 2015 | $1,389 | $53,890 | $15,000 | $38,890 |
| 2014 | $1,271 | $50,600 | $15,000 | $35,600 |
Source: Public Records
Map
Nearby Homes