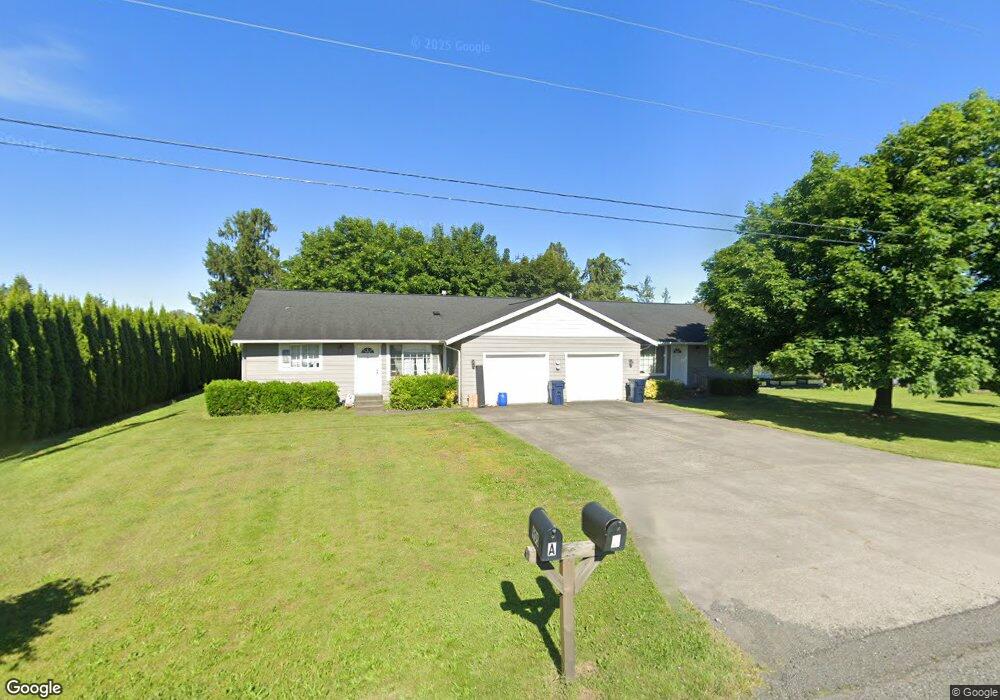
905 Nooksack Ave Nooksack, WA 98247
Estimated Value: $501,000 - $852,000
2
Beds
2
Baths
2,464
Sq Ft
$269/Sq Ft
Est. Value
About This Home
This home is located at 905 Nooksack Ave, Nooksack, WA 98247 and is currently estimated at $662,574, approximately $268 per square foot. 905 Nooksack Ave is a home located in Whatcom County with nearby schools including Nooksack Elementary School, Everson Elementary School, and Sumas Elementary School.
Ownership History
Date
Name
Owned For
Owner Type
Purchase Details
Closed on
Feb 27, 2004
Sold by
Litorja Marvin C
Bought by
Moe Chris C and Moe Kristine J
Current Estimated Value
Home Financials for this Owner
Home Financials are based on the most recent Mortgage that was taken out on this home.
Original Mortgage
$164,000
Interest Rate
5.65%
Mortgage Type
Purchase Money Mortgage
Purchase Details
Closed on
Jul 10, 2001
Sold by
Litorja Bonnie R
Bought by
Litorja Marvin C
Home Financials for this Owner
Home Financials are based on the most recent Mortgage that was taken out on this home.
Original Mortgage
$100,000
Interest Rate
7.26%
Create a Home Valuation Report for This Property
The Home Valuation Report is an in-depth analysis detailing your home's value as well as a comparison with similar homes in the area
Purchase History
| Date | Buyer | Sale Price | Title Company |
|---|---|---|---|
| Moe Chris C | $205,000 | Whatcom Land Title | |
| Litorja Marvin C | -- | Chicago Title Insurance | |
| Litorja Zella F | $140,000 | Chicago Title Insurance |
Source: Public Records
Mortgage History
| Date | Status | Borrower | Loan Amount |
|---|---|---|---|
| Closed | Moe Chris C | $164,000 | |
| Previous Owner | Litorja Zella F | $100,000 |
Source: Public Records
Tax History
| Year | Tax Paid | Tax Assessment Tax Assessment Total Assessment is a certain percentage of the fair market value that is determined by local assessors to be the total taxable value of land and additions on the property. | Land | Improvement |
|---|---|---|---|---|
| 2025 | $4,267 | $481,504 | $186,219 | $295,285 |
| 2024 | $4,315 | $466,283 | $178,200 | $288,083 |
| 2023 | $4,315 | $489,306 | $154,962 | $334,344 |
| 2022 | $3,949 | $440,825 | $139,608 | $301,217 |
| 2021 | $3,663 | $364,323 | $115,380 | $248,943 |
| 2020 | $3,512 | $296,204 | $93,807 | $202,397 |
| 2019 | $2,959 | $296,204 | $93,807 | $202,397 |
| 2018 | $3,738 | $284,183 | $90,000 | $194,183 |
| 2017 | $3,340 | $267,077 | $58,000 | $209,077 |
| 2016 | $3,188 | $246,466 | $53,500 | $192,966 |
| 2015 | $2,705 | $236,332 | $51,600 | $184,732 |
| 2014 | -- | $229,004 | $50,000 | $179,004 |
| 2013 | -- | $229,004 | $50,000 | $179,004 |
Source: Public Records
Map
Nearby Homes
- 512 Allison Way
- 705 E 6th St
- 412 W 3rd St
- 404 W 3rd St
- 308 W 3rd St
- 304 W 3rd St
- 109 W 2nd St
- 107 S Pass Rd Unit 23
- 107 Thendara Park Dr Unit C
- 1204 E Georgia Ln
- 3292 S Pass Rd
- 702 N Washington St
- 207 E Main St
- 412 W 4th St
- 320 W 4th St
- 308 W 4th St
- 332 W 4th St
- 324 W 4th St
- 409 W 4th St
- 316 W 4th St
Your Personal Tour Guide
Ask me questions while you tour the home.