Estimated Value: $249,571 - $289,000
2
Beds
2
Baths
1,682
Sq Ft
$164/Sq Ft
Est. Value
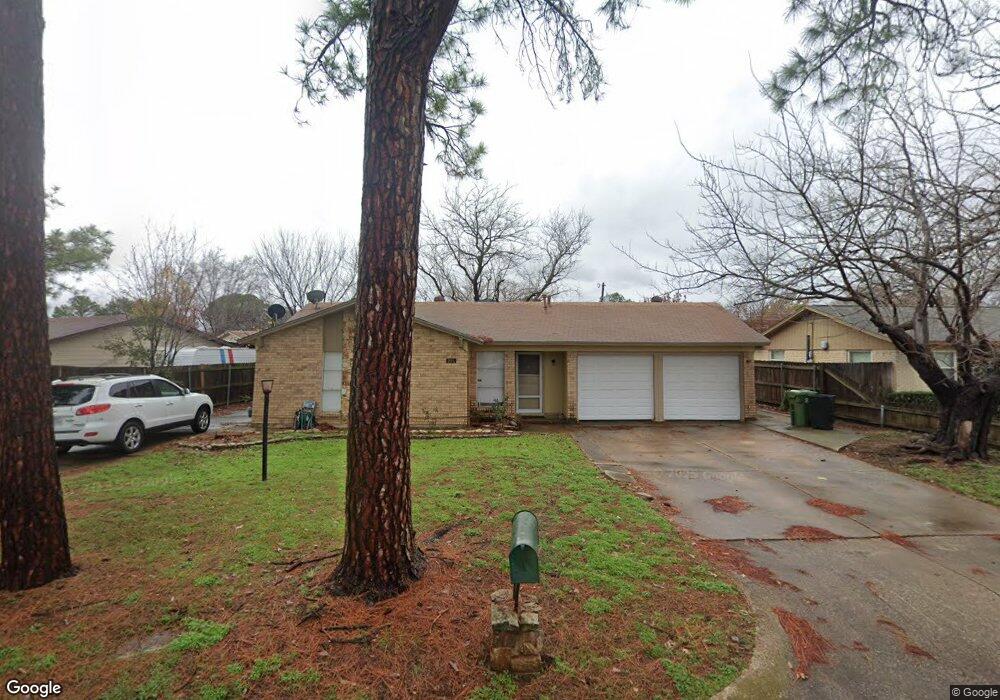
About This Home
This home is located at 905 Piccadilly Cir, Hurst, TX 76053 and is currently estimated at $276,643, approximately $164 per square foot. 905 Piccadilly Cir is a home located in Tarrant County with nearby schools including Donna Park Elementary, Bedford Junior High School, and L.D. Bell High School.
Ownership History
Date
Name
Owned For
Owner Type
Purchase Details
Closed on
Nov 15, 2010
Sold by
U S Bank National Association
Bought by
Ska Properties Llc
Current Estimated Value
Purchase Details
Closed on
Aug 3, 2010
Sold by
Lindley Danny W and Lindley Dana D
Bought by
Us Bank National Association
Purchase Details
Closed on
Dec 22, 2005
Sold by
Hackbarth E J
Bought by
Lindley Danny W and Lindley Dana D
Home Financials for this Owner
Home Financials are based on the most recent Mortgage that was taken out on this home.
Original Mortgage
$99,200
Interest Rate
8.41%
Mortgage Type
Stand Alone First
Purchase Details
Closed on
Mar 29, 1996
Sold by
Fabre Lennis Keith and Fabre Scarlett Shane
Bought by
Lindley Danny W and Lindley Dana D
Home Financials for this Owner
Home Financials are based on the most recent Mortgage that was taken out on this home.
Original Mortgage
$50,400
Interest Rate
7.35%
Create a Home Valuation Report for This Property
The Home Valuation Report is an in-depth analysis detailing your home's value as well as a comparison with similar homes in the area
Home Values in the Area
Average Home Value in this Area
Purchase History
| Date | Buyer | Sale Price | Title Company |
|---|---|---|---|
| Ska Properties Llc | -- | Lsi Title Agency Inc | |
| Us Bank National Association | $84,350 | None Available | |
| Lindley Danny W | -- | First Land Title | |
| Lindley Danny W | -- | Stewart Title |
Source: Public Records
Mortgage History
| Date | Status | Borrower | Loan Amount |
|---|---|---|---|
| Previous Owner | Lindley Danny W | $99,200 | |
| Previous Owner | Lindley Danny W | $50,400 |
Source: Public Records
Tax History
| Year | Tax Paid | Tax Assessment Tax Assessment Total Assessment is a certain percentage of the fair market value that is determined by local assessors to be the total taxable value of land and additions on the property. | Land | Improvement |
|---|---|---|---|---|
| 2025 | $3,472 | $149,000 | $32,040 | $116,960 |
| 2024 | $3,472 | $170,000 | $32,040 | $137,960 |
| 2023 | $3,406 | $170,000 | $26,700 | $143,300 |
| 2022 | $4,196 | $182,246 | $26,700 | $155,546 |
| 2021 | $3,883 | $161,000 | $45,000 | $116,000 |
| 2020 | $3,873 | $161,000 | $45,000 | $116,000 |
| 2019 | $3,940 | $161,000 | $45,000 | $116,000 |
| 2018 | $3,456 | $141,221 | $20,000 | $121,221 |
| 2017 | $3,723 | $147,105 | $20,000 | $127,105 |
| 2016 | $3,628 | $143,350 | $20,000 | $123,350 |
| 2015 | $2,601 | $99,200 | $17,000 | $82,200 |
| 2014 | $2,601 | $99,200 | $17,000 | $82,200 |
Source: Public Records
Map
Nearby Homes
- 913 Zelda Dr
- 655 Ridgeline Dr
- 1108 Billie Ruth Ln
- 623 Ridgeline Dr
- 925 Mountain Terrace
- 632 Melbourne Ct
- 829 Joanna Dr
- 1227 Wooded Trail
- 1218 Wooded Trail
- 1229 Wooded Trail
- 612 Melbourne Ct
- 1220 Woodland Park Dr
- 540 Billie Ruth Ln
- 1230 Woodland Park Dr
- 1230 Wooded Trail
- 609 Melbourne Rd
- 512 Billie Ruth Ln
- 729 W Cheryl Ave
- 712 Joanna Dr
- 549 Greenwood Cir
- 909 Piccadilly Cir
- 901 Piccadilly Cir
- 913 Piccadilly Cir
- 1020 Calcutta St
- 908 Piccadilly Cir
- 904 Piccadilly Cir
- 912 Piccadilly Cir
- 1008 Calcutta St
- 904 Venice St
- 908 Venice St
- 916 Piccadilly Cir
- 917 Piccadilly Cir
- 1004 Calcutta St
- 1021 Calcutta St
- 912 Venice St
- 1017 Calcutta St
- 1025 Calcutta St
- 920 Piccadilly Cir
- 913 Madrid St
- 917 Madrid St
Your Personal Tour Guide
Ask me questions while you tour the home.