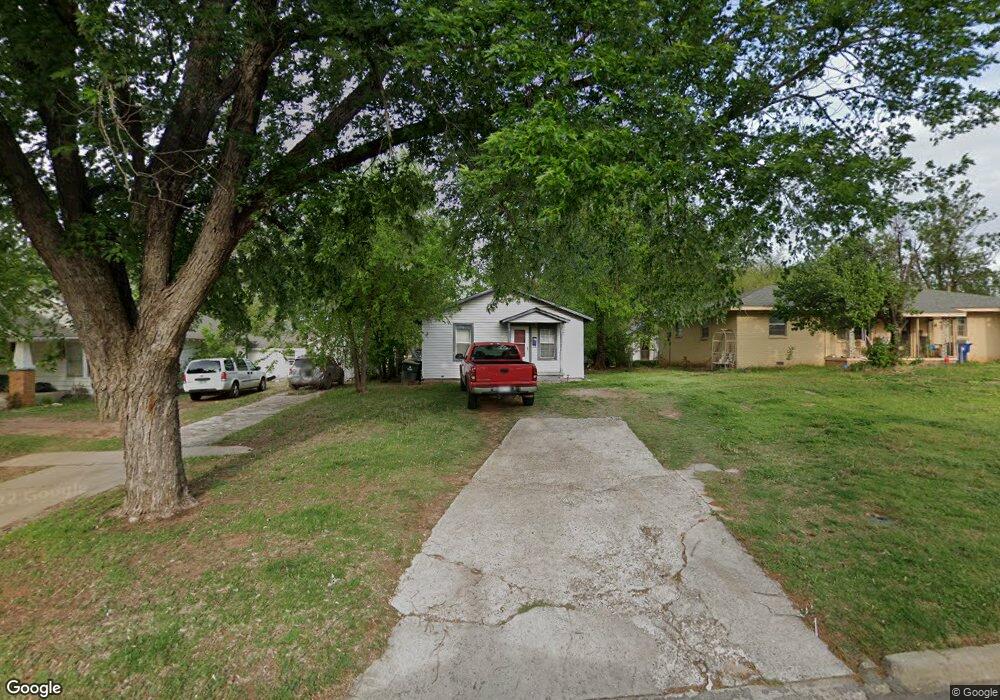
905 S 6th St Chickasha, OK 73018
Estimated Value: $56,000 - $89,000
2
Beds
1
Bath
750
Sq Ft
$97/Sq Ft
Est. Value
About This Home
This home is located at 905 S 6th St, Chickasha, OK 73018 and is currently estimated at $72,710, approximately $96 per square foot. 905 S 6th St is a home located in Grady County with nearby schools including Grand Avenue Elementary School, Chickasha Middle School, and Lincoln Elementary School.
Ownership History
Date
Name
Owned For
Owner Type
Purchase Details
Closed on
May 4, 2020
Sold by
Pearcy Alva J and Pearcy Alva June
Bought by
Resendez Martin P and Resendez Diana L
Current Estimated Value
Home Financials for this Owner
Home Financials are based on the most recent Mortgage that was taken out on this home.
Original Mortgage
$21,163
Outstanding Balance
$18,823
Interest Rate
3.5%
Mortgage Type
Commercial
Estimated Equity
$53,887
Purchase Details
Closed on
Apr 24, 2020
Sold by
Glass Sheldon Joe and Glass Fredia K
Bought by
Pearcy Alva J
Home Financials for this Owner
Home Financials are based on the most recent Mortgage that was taken out on this home.
Original Mortgage
$21,163
Outstanding Balance
$18,823
Interest Rate
3.5%
Mortgage Type
Commercial
Estimated Equity
$53,887
Purchase Details
Closed on
Oct 30, 2009
Sold by
Doan Douglas J and Doan Amy
Bought by
Fearcy Albert J and Pearcy Alva J
Create a Home Valuation Report for This Property
The Home Valuation Report is an in-depth analysis detailing your home's value as well as a comparison with similar homes in the area
Home Values in the Area
Average Home Value in this Area
Purchase History
| Date | Buyer | Sale Price | Title Company |
|---|---|---|---|
| Resendez Martin P | $19,000 | American Security Ttl Ins Co | |
| Pearcy Alva J | -- | None Available | |
| Fearcy Albert J | $10,000 | None Available |
Source: Public Records
Mortgage History
| Date | Status | Borrower | Loan Amount |
|---|---|---|---|
| Open | Resendez Martin P | $21,163 |
Source: Public Records
Tax History Compared to Growth
Tax History
| Year | Tax Paid | Tax Assessment Tax Assessment Total Assessment is a certain percentage of the fair market value that is determined by local assessors to be the total taxable value of land and additions on the property. | Land | Improvement |
|---|---|---|---|---|
| 2024 | $329 | $4,249 | $905 | $3,344 |
| 2023 | $329 | $4,125 | $1,370 | $2,755 |
| 2022 | $228 | $2,194 | $717 | $1,477 |
| 2021 | $210 | $2,090 | $569 | $1,521 |
| 2020 | $180 | $1,748 | $569 | $1,179 |
| 2019 | $168 | $1,665 | $542 | $1,123 |
| 2018 | $163 | $1,585 | $293 | $1,292 |
| 2017 | $156 | $1,509 | $282 | $1,227 |
| 2016 | $150 | $1,438 | $259 | $1,179 |
| 2015 | $137 | $1,369 | $257 | $1,112 |
| 2014 | $137 | $1,305 | $245 | $1,060 |
Source: Public Records
Map
Nearby Homes
- 910 S 6th St
- 1002 S 5th St
- 701 S 6th St
- 1027 S 7th St
- 1119 S 5th St
- 927 S 3rd St
- 1009 S 3rd St
- 926 S 9th St
- 511 W Minnesota Ave
- 502 S 7th St
- 408 S 5th St
- 1027 W Idaho Ave
- 909 W Minnesota Ave
- 904 W Minnesota Ave
- 316 S 6th St
- 302 S 6th St
- 1309 S Sheppard St
- 1527 S 6th St
- 1124 W Missouri Ave
- 828 S 12th St