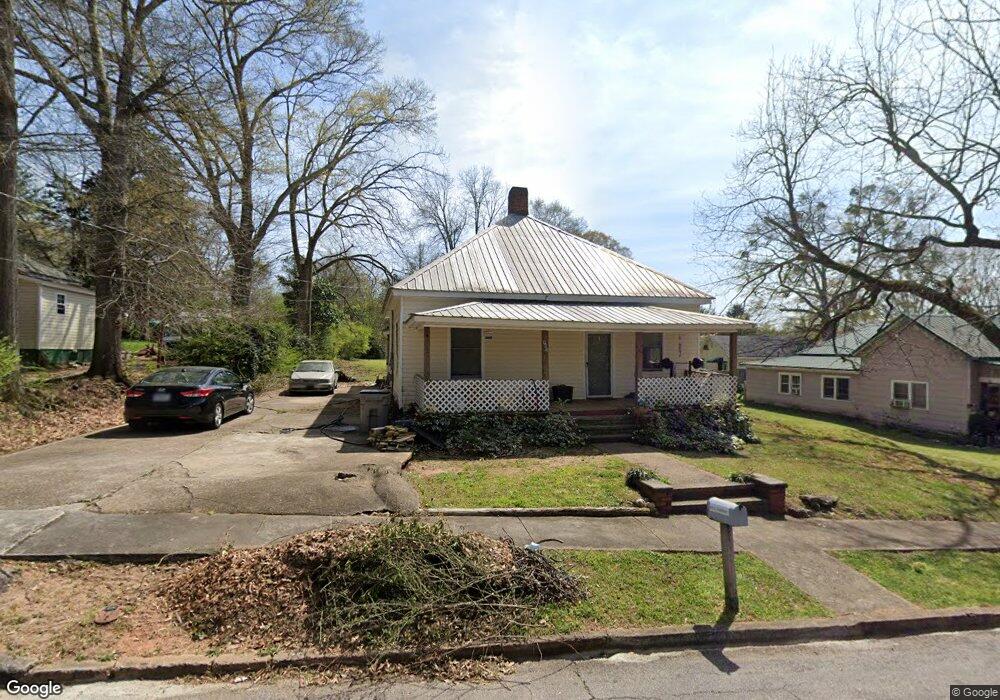
905 S Parkway Lagrange, GA 30240
Estimated Value: $83,000 - $116,426
3
Beds
1
Bath
1,414
Sq Ft
$72/Sq Ft
Est. Value
About This Home
This home is located at 905 S Parkway, Lagrange, GA 30240 and is currently estimated at $101,107, approximately $71 per square foot. 905 S Parkway is a home located in Troup County with nearby schools including Berta Weathersbee Elementary School, Whitesville Road Elementary School, and Rosemont Elementary School.
Ownership History
Date
Name
Owned For
Owner Type
Purchase Details
Closed on
May 30, 2008
Sold by
Hall Tamela Austin
Bought by
Dayspring Investment Propertie
Current Estimated Value
Purchase Details
Closed on
Jan 4, 2008
Sold by
King Investment Of Trp Cou
Bought by
Hall Tamela Austin
Purchase Details
Closed on
Oct 19, 2007
Sold by
Toney Misty L
Bought by
Leich Erik Paul
Purchase Details
Closed on
Sep 28, 2001
Sold by
Pete Bryan W W
Bought by
Stephen C King
Purchase Details
Closed on
Dec 28, 1990
Sold by
Kenneth M Lewis
Bought by
Pete Bryan W W
Purchase Details
Closed on
Dec 28, 1989
Bought by
Kenneth M Lewis
Purchase Details
Closed on
Aug 1, 1985
Sold by
Massey Dians L
Purchase Details
Closed on
May 26, 1984
Sold by
Kelley Larry
Bought by
Massey Dians L
Purchase Details
Closed on
May 1, 1984
Sold by
Kelley Lucille S
Bought by
Kelley Larry
Purchase Details
Closed on
Jan 1, 1948
Bought by
Kelley Lucille S
Create a Home Valuation Report for This Property
The Home Valuation Report is an in-depth analysis detailing your home's value as well as a comparison with similar homes in the area
Home Values in the Area
Average Home Value in this Area
Purchase History
| Date | Buyer | Sale Price | Title Company |
|---|---|---|---|
| Dayspring Investment Propertie | -- | -- | |
| Hall Tamela Austin | $39,000 | -- | |
| Leich Erik Paul | $76,900 | -- | |
| Stephen C King | $18,000 | -- | |
| Pete Bryan W W | $50,000 | -- | |
| Kenneth M Lewis | -- | -- | |
| -- | $25,000 | -- | |
| Massey Dians L | $17,000 | -- | |
| Kelley Larry | $10,000 | -- | |
| Kelley Lucille S | -- | -- |
Source: Public Records
Tax History Compared to Growth
Tax History
| Year | Tax Paid | Tax Assessment Tax Assessment Total Assessment is a certain percentage of the fair market value that is determined by local assessors to be the total taxable value of land and additions on the property. | Land | Improvement |
|---|---|---|---|---|
| 2024 | $825 | $30,240 | $3,200 | $27,040 |
| 2023 | $764 | $28,000 | $3,200 | $24,800 |
| 2022 | $720 | $25,800 | $3,200 | $22,600 |
| 2021 | $709 | $23,520 | $3,200 | $20,320 |
| 2020 | $709 | $23,520 | $3,200 | $20,320 |
| 2019 | $657 | $21,800 | $3,200 | $18,600 |
| 2018 | $660 | $21,880 | $3,200 | $18,680 |
| 2017 | $660 | $21,880 | $3,200 | $18,680 |
| 2016 | $652 | $21,604 | $3,200 | $18,404 |
| 2015 | $653 | $21,628 | $3,224 | $18,404 |
| 2014 | $625 | $20,659 | $3,224 | $17,435 |
| 2013 | -- | $21,445 | $3,224 | $18,221 |
Source: Public Records
Map
Nearby Homes