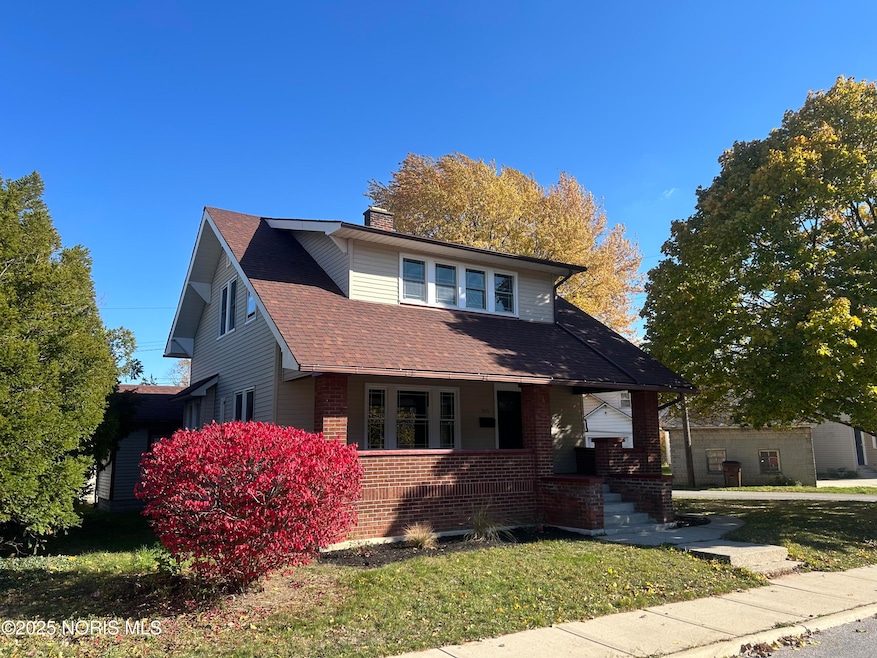
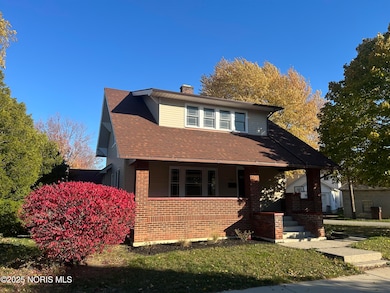
905 S West St Findlay, OH 45840
Estimated payment $1,095/month
Highlights
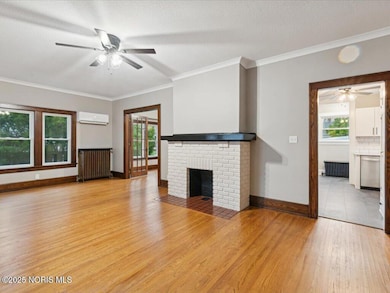
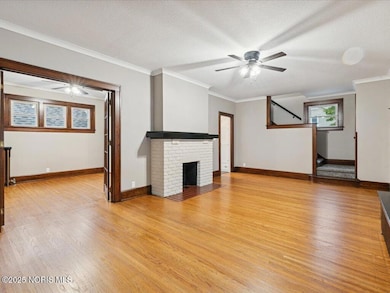
- Fireplace
- Hot Water Heating System
- Carpet
- Cooling Available
- 2 Car Garage
- 2-minute walk to Wood County Fair
About This Home
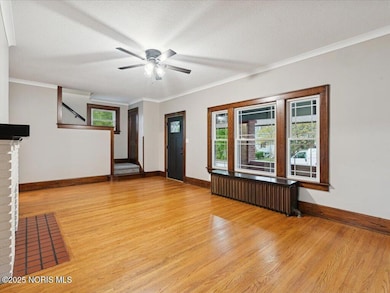
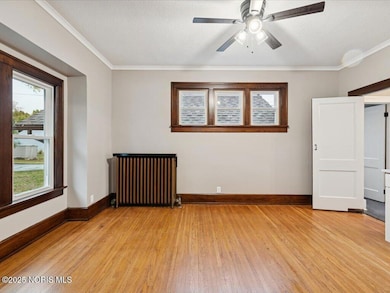
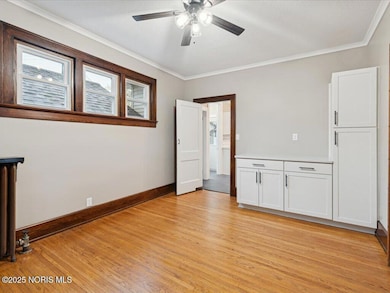
Make this charming and newly renovated craftsman style home yours today! Home features refinished original wood floors, new carpet and LVT flooring throughout. Brand new kitchen. New mini splits. Brand new windows. Dual closets. Full unfinished basement. Old world character mixed with fresh updates. Located in Donnell School district with quick access to I75! This home also features a large front porch for those relaxing days. Agent is a licensed realtor in the state of Ohio.

Home Details
Home Type
- Single Family
Est. Annual Taxes
- $1,143
Year Built
- Built in 1920
Lot Details
- 3,136 Sq Ft Lot
- Lot Dimensions are 50x63
Parking
- 2 Car Garage
- Alley Access
- Driveway
- Off-Street Parking
Home Design
- Brick Exterior Construction
- Shingle Roof
- Vinyl Siding
Interior Spaces
- 1,412 Sq Ft Home
- 1-Story Property
- Fireplace
- Window Screens
- Carpet
Kitchen
- Microwave
- Dishwasher
Bedrooms and Bathrooms
- 2 Bedrooms
Laundry
- Laundry on upper level
- Washer and Electric Dryer Hookup
Basement
- Basement Fills Entire Space Under The House
- Sump Pump
Schools
- Northview Elementary School
- Findlay High School
Utilities
- Cooling Available
- Radiant Heating System
- Hot Water Heating System
- Water Heater
Listing and Financial Details
- Home warranty included in the sale of the property
- Assessor Parcel Number 560000191640
Map
Home Values in the Area
Average Home Value in this Area
Tax History
| Year | Tax Paid | Tax Assessment Tax Assessment Total Assessment is a certain percentage of the fair market value that is determined by local assessors to be the total taxable value of land and additions on the property. | Land | Improvement |
|---|---|---|---|---|
| 2024 | $1,143 | $41,970 | $3,530 | $38,440 |
| 2023 | $1,167 | $41,970 | $3,530 | $38,440 |
| 2022 | $1,178 | $41,970 | $3,530 | $38,440 |
| 2021 | $1,066 | $34,950 | $3,620 | $31,330 |
| 2020 | $1,066 | $34,950 | $3,620 | $31,330 |
| 2019 | $1,045 | $34,950 | $3,620 | $31,330 |
| 2018 | $936 | $30,290 | $2,550 | $27,740 |
| 2017 | $468 | $30,290 | $2,550 | $27,740 |
| 2016 | $934 | $30,290 | $2,550 | $27,740 |
| 2015 | $460 | $19,280 | $2,550 | $16,730 |
| 2014 | $460 | $19,280 | $2,550 | $16,730 |
| 2012 | $465 | $19,280 | $2,550 | $16,730 |
Property History
| Date | Event | Price | List to Sale | Price per Sq Ft |
|---|---|---|---|---|
| 11/10/2025 11/10/25 | Price Changed | $189,900 | -5.0% | $134 / Sq Ft |
| 10/31/2025 10/31/25 | For Sale | $199,900 | -- | $142 / Sq Ft |
Purchase History
| Date | Type | Sale Price | Title Company |
|---|---|---|---|
| Executors Deed | $60,000 | Mid Am Title | |
| Executors Deed | $60,000 | Mid Am Title | |
| Deed | $31,500 | -- |
Mortgage History
| Date | Status | Loan Amount | Loan Type |
|---|---|---|---|
| Open | $500,000 | Construction | |
| Closed | $500,000 | Construction |
Source: Northwest Ohio Real Estate Information Service (NORIS)
MLS Number: 10000885
APN: 56-0000191640
Disclaimer: Certain information contained herein is derived from information provided by parties other than Homes.com. All information provided is deemed reliable, but is not guaranteed to be accurate and should be independently verified.
![]() IDX information is provided exclusively for personal, non-commercial use, and may not be used for any purpose other than to identify prospective properties consumers may be interested in purchasing. Information is deemed reliable but not guaranteed. ©2025 NORIS. All rights reserved.
IDX information is provided exclusively for personal, non-commercial use, and may not be used for any purpose other than to identify prospective properties consumers may be interested in purchasing. Information is deemed reliable but not guaranteed. ©2025 NORIS. All rights reserved.
- 225 Lima Ave
- 412 Lima Ave
- 416 1/2 Lima Ave
- 720 S West St
- 1115 Liberty St
- 419 W Lincoln St
- 535 W Lima St
- 202 Hancock St
- 527 W Lincoln St
- 829 Maple Ave
- 514 Liberty St
- 1006 Washington Ave
- 123 Glendale Ave
- 420 1st St
- 1119 Washington Ave
- 817 Park St
- 1421 Hurd Ave
- 801 W Sandusky St
- 424 3rd St
- 1109 Park St
- 868 1/2 S Main St Unit 2
- 624 1/2 S Main St Unit 7
- 626 S Main St Unit 2
- 807 Maple Ave Unit 807 Maple Ave (U3), Findlay Ohio, 45840
- 318 W Crawford St
- 320 S Main St Unit C
- 323 S Main St Unit 303
- 700-714 Putnam St
- 222 S Main St Unit 2
- 411 W Mcpherson Ave
- 200-216 S West St
- 207 Washington St Unit B
- 219 Washington St Unit B
- 637 2nd St
- 300 Washington St Unit B
- 319 Portz Ave Unit Upper
- 514 E Sandusky St Unit A
- 1200 Putnam St
- 130 Walnut St
- 130 Walnut St