Estimated Value: $603,000 - $721,000
4
Beds
3
Baths
2,681
Sq Ft
$240/Sq Ft
Est. Value
About This Home
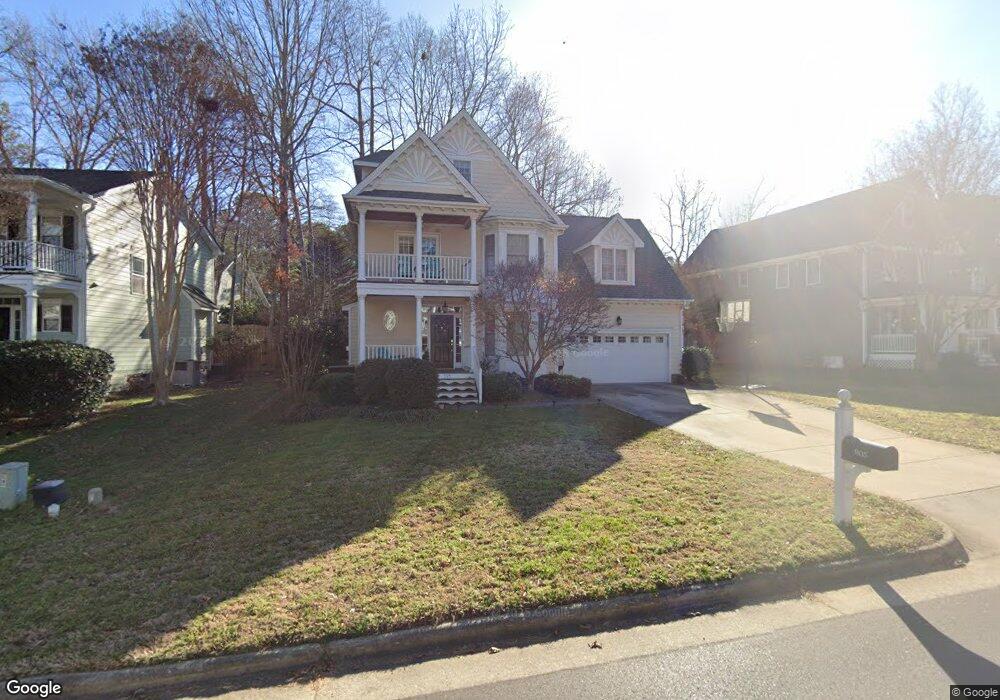
This home is located at 905 Scotts Ridge Trail, Apex, NC 27502 and is currently estimated at $644,728, approximately $240 per square foot. 905 Scotts Ridge Trail is a home located in Wake County with nearby schools including Scotts Ridge Elementary School, Apex Middle, and Apex High School.
Ownership History
Date
Name
Owned For
Owner Type
Purchase Details
Closed on
Sep 2, 2014
Bought by
Connelly Joseph W and Connelly Kristin E
Current Estimated Value
Purchase Details
Closed on
Apr 27, 2001
Sold by
Cattano Construction Inc
Bought by
Okeefe Patrick C and Okeefe Elizabeth H
Home Financials for this Owner
Home Financials are based on the most recent Mortgage that was taken out on this home.
Original Mortgage
$217,971
Interest Rate
6.98%
Purchase Details
Closed on
Oct 13, 2000
Sold by
Stratford Wood Llc
Bought by
Cattano Construction Inc
Home Financials for this Owner
Home Financials are based on the most recent Mortgage that was taken out on this home.
Original Mortgage
$35,042
Interest Rate
7.91%
Mortgage Type
Construction
Create a Home Valuation Report for This Property
The Home Valuation Report is an in-depth analysis detailing your home's value as well as a comparison with similar homes in the area
Home Values in the Area
Average Home Value in this Area
Purchase History
| Date | Buyer | Sale Price | Title Company |
|---|---|---|---|
| Connelly Joseph W | $338,000 | -- | |
| Okeefe Patrick C | $230,000 | -- | |
| Cattano Construction Inc | $33,000 | -- |
Source: Public Records
Mortgage History
| Date | Status | Borrower | Loan Amount |
|---|---|---|---|
| Previous Owner | Okeefe Patrick C | $217,971 | |
| Previous Owner | Cattano Construction Inc | $35,042 |
Source: Public Records
Tax History Compared to Growth
Tax History
| Year | Tax Paid | Tax Assessment Tax Assessment Total Assessment is a certain percentage of the fair market value that is determined by local assessors to be the total taxable value of land and additions on the property. | Land | Improvement |
|---|---|---|---|---|
| 2025 | $5,099 | $581,708 | $180,000 | $401,708 |
| 2024 | $4,985 | $581,708 | $180,000 | $401,708 |
| 2023 | $4,096 | $371,580 | $80,000 | $291,580 |
| 2022 | $3,845 | $371,580 | $80,000 | $291,580 |
| 2021 | $3,699 | $371,580 | $80,000 | $291,580 |
| 2020 | $3,661 | $371,580 | $80,000 | $291,580 |
| 2019 | $3,554 | $311,134 | $80,000 | $231,134 |
| 2018 | $3,347 | $311,134 | $80,000 | $231,134 |
| 2017 | $3,116 | $311,134 | $80,000 | $231,134 |
| 2016 | $3,071 | $311,134 | $80,000 | $231,134 |
| 2015 | $2,984 | $286,333 | $62,000 | $224,333 |
| 2014 | -- | $286,333 | $62,000 | $224,333 |
Source: Public Records
Map
Nearby Homes
- 1131 Bungalow Park Dr
- 1042 Mica Lamp Ct
- 104 Pine Tag Ct
- 1706 Patterson Grove Rd
- 2129 Kelly Rd
- 428 Heritage Village Ln
- 1773 Town Home Dr
- 441 Heritage Village Ln
- 448 Heritage Village Ln
- 402 Village Loop Dr
- 460 Heritage Village Ln
- 1701 Barrett Run Trail
- 1910 Woodall Crest Dr
- 1726 Barrett Run Trail
- 1880 Woodall Crest Dr
- 541 Village Loop Dr
- 3014 Silky Dogwood Trail
- 1004 Wild Sonnet Ct
- 1002 Tribble Gate Ct
- 2008 Silky Dogwood Trail
- 903 Scotts Ridge Trail
- 907 Scotts Ridge Trail
- 205 Rushing Wind Way
- 203 Rushing Wind Way
- 901 Scotts Ridge Trail
- 1001 Scotts Ridge Trail
- 207 Rushing Wind Way
- 100 Briarberry Ct
- 201 Rushing Wind Way
- 904 Scotts Ridge Trail
- 807 Scotts Ridge Trail
- 1003 Scotts Ridge Trail
- 209 Rushing Wind Way
- 101 Magnolia Breeze Ct
- 104 Briarberry Ct
- 1002 Scotts Ridge Trail
- 205 Country Valley Ct
- 203 Country Valley Ct
- 1005 Scotts Ridge Trail
- 805 Scotts Ridge Trail