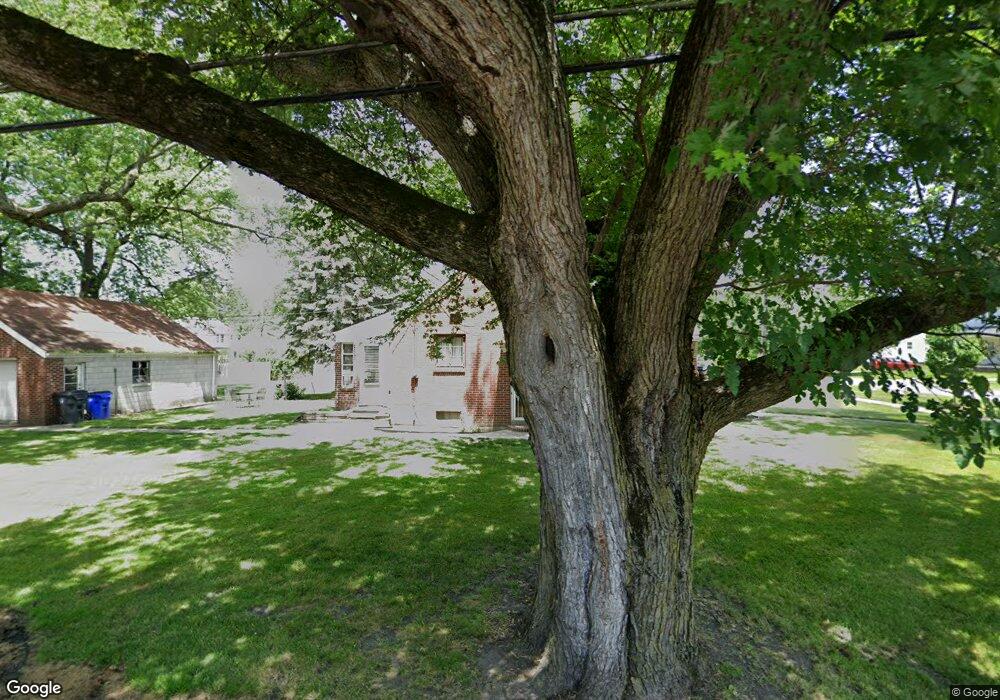
905 Searles Rd Toledo, OH 43607
Scott Park NeighborhoodEstimated Value: $126,000 - $156,000
3
Beds
2
Baths
1,514
Sq Ft
$92/Sq Ft
Est. Value
About This Home
This home is located at 905 Searles Rd, Toledo, OH 43607 and is currently estimated at $139,300, approximately $92 per square foot. 905 Searles Rd is a home located in Lucas County with nearby schools including Keyser Elementary School, Rogers High School, and Victory Academy of Toledo.
Ownership History
Date
Name
Owned For
Owner Type
Purchase Details
Closed on
Oct 10, 2023
Sold by
Taylor Nazhiere D
Bought by
Mdq4 Llc
Current Estimated Value
Purchase Details
Closed on
Jul 11, 2023
Sold by
Concepts Limited And Ohio Llc
Bought by
Taylor Nazhiere D
Purchase Details
Closed on
Sep 2, 2022
Sold by
Concepts Limited Llc
Bought by
Mdo4 Llc
Purchase Details
Closed on
Apr 5, 2017
Sold by
Taylor Calvin
Bought by
Concepts Limited Llc
Purchase Details
Closed on
Dec 21, 2012
Sold by
Taylor Alma G
Bought by
Taylor Calvin
Purchase Details
Closed on
Sep 15, 2008
Sold by
Taylor Calvin
Bought by
Taylor Alma and Taylor Linda D
Purchase Details
Closed on
May 25, 1994
Sold by
Taylor E L and A L
Create a Home Valuation Report for This Property
The Home Valuation Report is an in-depth analysis detailing your home's value as well as a comparison with similar homes in the area
Home Values in the Area
Average Home Value in this Area
Purchase History
| Date | Buyer | Sale Price | Title Company |
|---|---|---|---|
| Mdq4 Llc | $10,000 | None Listed On Document | |
| Taylor Nazhiere D | -- | None Listed On Document | |
| Mdo4 Llc | $7,142,682 | -- | |
| Concepts Limited Llc | -- | None Available | |
| Taylor Calvin | -- | None Available | |
| Taylor Alma | -- | Attorney | |
| -- | -- | -- |
Source: Public Records
Tax History Compared to Growth
Tax History
| Year | Tax Paid | Tax Assessment Tax Assessment Total Assessment is a certain percentage of the fair market value that is determined by local assessors to be the total taxable value of land and additions on the property. | Land | Improvement |
|---|---|---|---|---|
| 2024 | $27,670 | $26,180 | $7,070 | $19,110 |
| 2023 | $1,990 | $24,990 | $4,725 | $20,265 |
| 2022 | $1,947 | $24,990 | $4,725 | $20,265 |
| 2021 | $2,010 | $24,990 | $4,725 | $20,265 |
| 2020 | $2,209 | $23,940 | $4,515 | $19,425 |
| 2019 | $2,115 | $23,940 | $4,515 | $19,425 |
| 2018 | $1,832 | $23,940 | $4,515 | $19,425 |
| 2017 | $9,692 | $23,380 | $4,410 | $18,970 |
| 2016 | $7,240 | $66,800 | $12,600 | $54,200 |
| 2015 | $1,545 | $66,800 | $12,600 | $54,200 |
| 2014 | -- | $23,380 | $4,410 | $18,970 |
| 2013 | $920 | $23,380 | $4,410 | $18,970 |
Source: Public Records
Map
Nearby Homes
- 1125 Secor Rd
- 615 Cuthbert Rd
- 826 Ranch Dr
- 1117 Broer Ave
- 914 Turner Ave
- 735 Southbriar Rd
- 3825 Whitegate Dr
- 2013 Bretton Place
- 3205 Kylemore Rd
- 3155 Kylemore Rd
- 539 Independence Rd
- 3614 Edgevale Rd
- 3305 W Bancroft St
- 1408 Roosevelt Ave
- 514 Conrad Ave
- 2666 Montebello Rd
- 4111 Kingsley Ct
- 2221 Meadowwood Dr
- 54 Independence Rd
- 2235 Meadowwood Dr