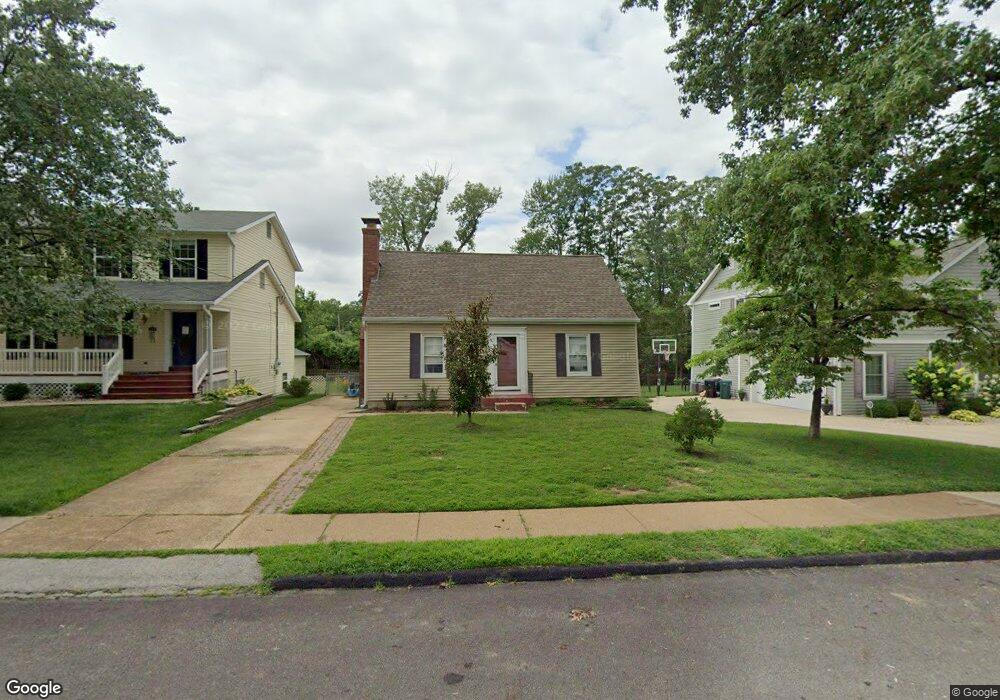
905 Simmons Ave Saint Louis, MO 63122
Estimated Value: $316,000 - $394,880
3
Beds
1
Bath
1,030
Sq Ft
$342/Sq Ft
Est. Value
About This Home
This home is located at 905 Simmons Ave, Saint Louis, MO 63122 and is currently estimated at $352,470, approximately $342 per square foot. 905 Simmons Ave is a home located in St. Louis County with nearby schools including W.W. Keysor Elementary School, North Kirkwood Middle School, and Kirkwood Senior High School.
Ownership History
Date
Name
Owned For
Owner Type
Purchase Details
Closed on
Feb 23, 2015
Sold by
Rollings Mary Beth
Bought by
Rollings Mary Beth
Current Estimated Value
Home Financials for this Owner
Home Financials are based on the most recent Mortgage that was taken out on this home.
Original Mortgage
$158,201
Outstanding Balance
$119,465
Interest Rate
3.62%
Mortgage Type
FHA
Estimated Equity
$233,005
Purchase Details
Closed on
Mar 24, 2009
Sold by
Boysen John and Boysen Valerie A
Bought by
Rollings Mary Beth
Home Financials for this Owner
Home Financials are based on the most recent Mortgage that was taken out on this home.
Original Mortgage
$173,789
Interest Rate
5.21%
Mortgage Type
FHA
Purchase Details
Closed on
Jun 30, 1999
Sold by
Legg David G and Legg Laura H
Bought by
Boysen John and Boysen Valerie A
Home Financials for this Owner
Home Financials are based on the most recent Mortgage that was taken out on this home.
Original Mortgage
$129,934
Interest Rate
7.21%
Create a Home Valuation Report for This Property
The Home Valuation Report is an in-depth analysis detailing your home's value as well as a comparison with similar homes in the area
Home Values in the Area
Average Home Value in this Area
Purchase History
| Date | Buyer | Sale Price | Title Company |
|---|---|---|---|
| Rollings Mary Beth | -- | Title Partners Agency Llc | |
| Rollings Mary Beth | $177,000 | None Available | |
| Boysen John | $130,000 | -- |
Source: Public Records
Mortgage History
| Date | Status | Borrower | Loan Amount |
|---|---|---|---|
| Open | Rollings Mary Beth | $158,201 | |
| Closed | Rollings Mary Beth | $173,789 | |
| Previous Owner | Boysen John | $129,934 |
Source: Public Records
Tax History
| Year | Tax Paid | Tax Assessment Tax Assessment Total Assessment is a certain percentage of the fair market value that is determined by local assessors to be the total taxable value of land and additions on the property. | Land | Improvement |
|---|---|---|---|---|
| 2025 | $3,301 | $88,940 | $69,120 | $19,820 |
| 2024 | $3,249 | $52,410 | $42,240 | $10,170 |
| 2023 | $3,249 | $52,410 | $42,240 | $10,170 |
| 2022 | $4,139 | $62,410 | $43,090 | $19,320 |
| 2021 | $4,085 | $62,410 | $43,090 | $19,320 |
| 2020 | $3,086 | $45,240 | $40,010 | $5,230 |
| 2019 | $3,087 | $45,240 | $40,010 | $5,230 |
| 2018 | $2,718 | $35,140 | $27,650 | $7,490 |
| 2017 | $2,714 | $35,140 | $27,650 | $7,490 |
| 2016 | $1,927 | $25,030 | $21,510 | $3,520 |
Source: Public Records
Map
Nearby Homes
- 909 Cleveland Ave
- 966 N Geyer Rd
- 812 Cleveland Ave
- 613 Jasmin Dr
- 1025 Barry Ct
- 736 Evans Ave
- 516 Kirkshire Dr
- 638 Evans Ave
- 11344 Manchester Rd
- 531 W Essex Ave
- 140 W Sarah Ave
- 954 Rochdale Dr
- 216 W Essex Ave
- 1223 Simmons Ave
- 1056 Cedargate Dr
- 1144 Missouri Ave
- 441 Dickens Ave
- 1209 Missouri Ave
- 123 W Bodley Ave Unit 303
- 523 W Washington Ave
- 903 Simmons Ave
- 907 Simmons Ave
- 901 Simmons Ave
- 911 Simmons Ave
- 906 N Geyer Rd
- 904 N Geyer Rd
- 916 N Geyer Rd
- 915 Simmons Ave
- 839 Simmons Ave
- 910 Simmons Ave
- 912 Simmons Ave
- 920 N Geyer Rd
- 908 Simmons Ave
- 914 Simmons Ave
- 924 N Geyer Rd
- 444 Barter Ave
- 835 Simmons Ave
- 916 Simmons Ave
- 917 Simmons Ave
- 896 Simmons Ave
Your Personal Tour Guide
Ask me questions while you tour the home.