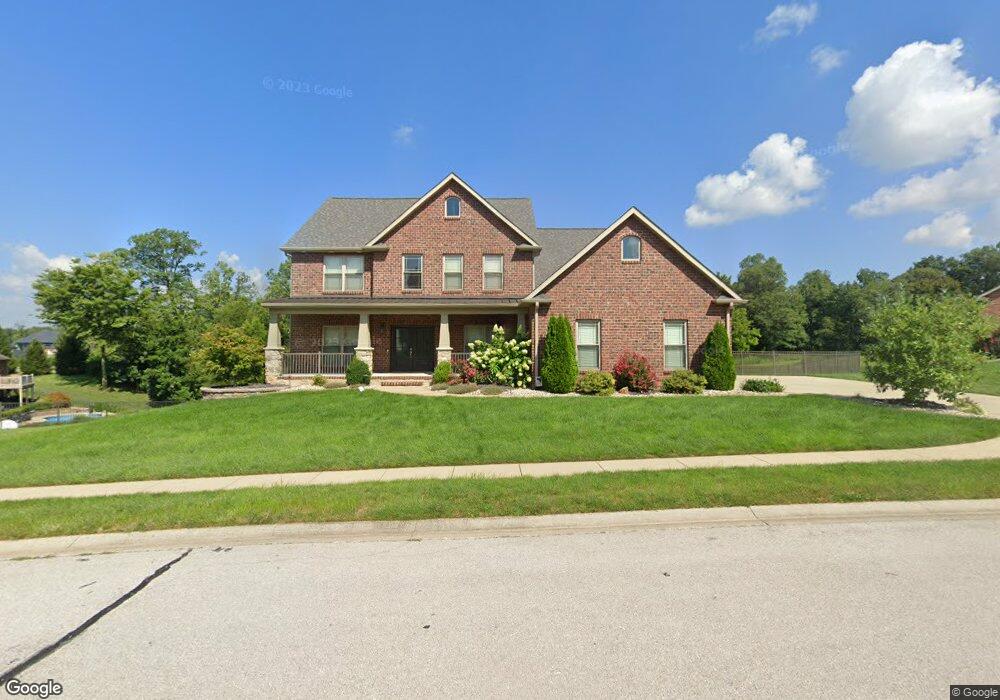
905 Spyglass Hill Ct Caseyville, IL 62232
Estimated Value: $804,000 - $954,000
--
Bed
--
Bath
2,624
Sq Ft
$330/Sq Ft
Est. Value
About This Home
This home is located at 905 Spyglass Hill Ct, Caseyville, IL 62232 and is currently estimated at $864,880, approximately $329 per square foot. 905 Spyglass Hill Ct is a home located in St. Clair County with nearby schools including Schaefer Elementary School, Fulton Junior High School, and O'Fallon Township High School.
Ownership History
Date
Name
Owned For
Owner Type
Purchase Details
Closed on
Mar 18, 2025
Sold by
Oconnor Shawn D and Oconnor Amanda K
Bought by
Oconnor Amanda K and Gallagher William R
Current Estimated Value
Home Financials for this Owner
Home Financials are based on the most recent Mortgage that was taken out on this home.
Original Mortgage
$340,000
Outstanding Balance
$338,177
Interest Rate
6.63%
Mortgage Type
New Conventional
Estimated Equity
$526,703
Purchase Details
Closed on
Mar 16, 2016
Sold by
Maduri Dominic S and Maduri Jane A
Bought by
Connor Shawn D O and Gallagher Amanda K
Purchase Details
Closed on
Mar 24, 2011
Sold by
Jh & Hh Holdings L L C
Bought by
Maduri Dominic S and Maduri Jane A
Purchase Details
Closed on
Jun 28, 2006
Sold by
419 Ocr Inc
Bought by
Jh & Hh Holdings Llc
Create a Home Valuation Report for This Property
The Home Valuation Report is an in-depth analysis detailing your home's value as well as a comparison with similar homes in the area
Home Values in the Area
Average Home Value in this Area
Purchase History
| Date | Buyer | Sale Price | Title Company |
|---|---|---|---|
| Oconnor Amanda K | -- | Community Title | |
| Connor Shawn D O | -- | Fatic | |
| Maduri Dominic S | $90,000 | Advanced Title Solutions Inc | |
| Jh & Hh Holdings Llc | $77,500 | First American Title Ins Co |
Source: Public Records
Mortgage History
| Date | Status | Borrower | Loan Amount |
|---|---|---|---|
| Open | Oconnor Amanda K | $340,000 |
Source: Public Records
Tax History Compared to Growth
Tax History
| Year | Tax Paid | Tax Assessment Tax Assessment Total Assessment is a certain percentage of the fair market value that is determined by local assessors to be the total taxable value of land and additions on the property. | Land | Improvement |
|---|---|---|---|---|
| 2024 | $17,185 | $257,075 | $30,780 | $226,295 |
| 2023 | $15,963 | $227,460 | $27,234 | $200,226 |
| 2022 | $16,130 | $222,156 | $26,691 | $195,465 |
| 2021 | $15,278 | $210,854 | $25,333 | $185,521 |
| 2020 | $15,143 | $199,733 | $23,997 | $175,736 |
| 2019 | $15,583 | $199,733 | $23,997 | $175,736 |
| 2018 | $14,700 | $187,480 | $23,758 | $163,722 |
| 2017 | $2,134 | $22,794 | $22,794 | $0 |
| 2016 | $2,119 | $22,279 | $22,279 | $0 |
| 2014 | $1,181 | $27,020 | $27,020 | $0 |
| 2013 | $2,365 | $27,518 | $27,518 | $0 |
Source: Public Records
Map
Nearby Homes
- 305 Forest Oaks Dr
- 363 Old Collinsville Rd
- 1034 Far Oaks Dr
- 609 Tea Olive Blvd
- 817 Golden Bell Ln
- 805 Golden Bell Ln
- 1012 Crooked Stick Dr
- 812 Green Jacket Way
- 804 Green Jacket Way
- 663 Tea Olive Blvd
- 641 Ambrose Dr
- 829 Bushwood Way
- 837 Bushwood Way
- 28 Geneva Dr
- 7745 N Illinois St
- 7751 N Illinois St
- 1128 Pisa Dr
- 713 Conner Cir
- 107 Bethel Mine Rd
- 853 Bassett St
- 909 Spyglass Hill Ct
- 901 Spyglass Hill Ct
- 904 Spyglass Hill Ct
- 324 Forest Oaks Dr
- 900 Spyglass Hill Ct
- 332 Forest Oaks Dr
- 336 Forest Oaks Dr
- 325 Forest Oaks Dr
- 329 Forest Oaks Dr
- 333 Forest Oaks Dr
- 321 Forest Oaks Dr
- 316 Forest Oaks Dr
- 340 Forest Oaks Dr
- 337 Forest Oaks Dr
- 904 Shadow Creek Ct
- 904 Shadow Creek Ct
- 344 Forest Oaks Dr
- 341 Forest Oaks Dr
- 317 Forest Oaks Dr
- 304 Forest Oaks Dr