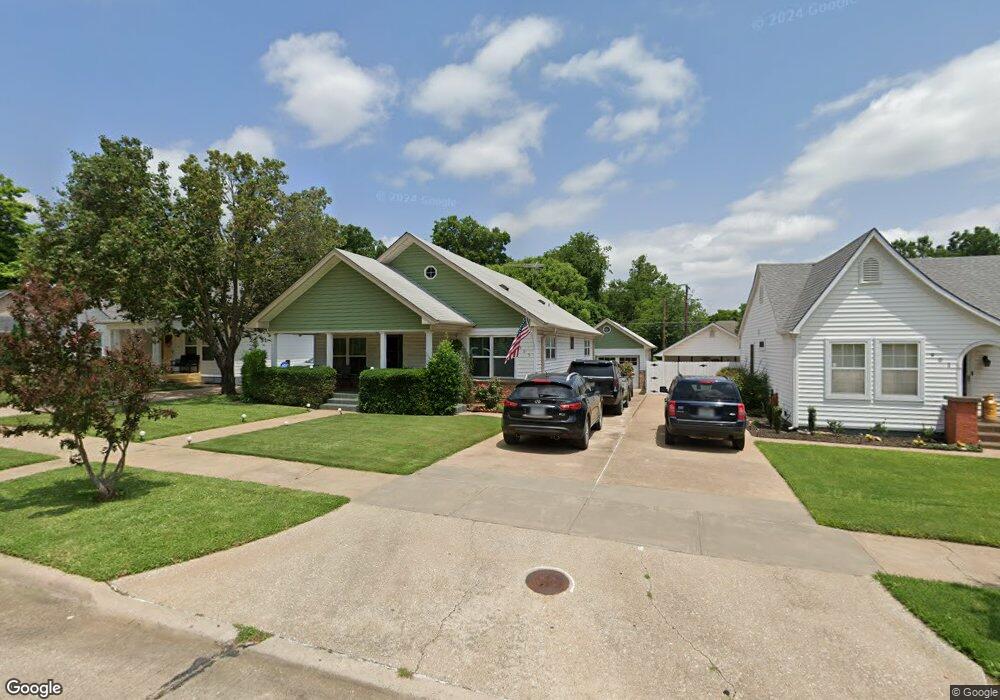
905 W Shepherd St Denison, TX 75020
Estimated Value: $274,000 - $274,481
3
Beds
2
Baths
2,061
Sq Ft
$133/Sq Ft
Est. Value
About This Home
This home is located at 905 W Shepherd St, Denison, TX 75020 and is currently estimated at $274,241, approximately $133 per square foot. 905 W Shepherd St is a home located in Grayson County with nearby schools including Houston Elementary School, Scott Middle School, and Denison High School.
Ownership History
Date
Name
Owned For
Owner Type
Purchase Details
Closed on
Aug 31, 2023
Sold by
Handy Priscilla
Bought by
Handy Priscilla
Current Estimated Value
Purchase Details
Closed on
Aug 31, 2021
Sold by
Handy Priscilla
Bought by
Parker Nyla Joyce
Purchase Details
Closed on
Aug 26, 2020
Sold by
Nevil Judith W and Nevil Garland
Bought by
Handy Priscilla
Home Financials for this Owner
Home Financials are based on the most recent Mortgage that was taken out on this home.
Original Mortgage
$189,000
Interest Rate
2.9%
Mortgage Type
VA
Purchase Details
Closed on
Aug 9, 2004
Sold by
Czeczotka Dorothea and Czeczotka Murray M
Bought by
Nevil Judith W
Purchase Details
Closed on
Jul 23, 2004
Sold by
Nevil Judith W
Bought by
Nevil Judith W and Czeczotka Dorothea
Create a Home Valuation Report for This Property
The Home Valuation Report is an in-depth analysis detailing your home's value as well as a comparison with similar homes in the area
Home Values in the Area
Average Home Value in this Area
Purchase History
| Date | Buyer | Sale Price | Title Company |
|---|---|---|---|
| Handy Priscilla | -- | None Listed On Document | |
| Parker Nyla Joyce | -- | None Available | |
| Handy Priscilla | -- | None Available | |
| Nevil Judith W | -- | -- | |
| Nevil Judith W | -- | -- |
Source: Public Records
Mortgage History
| Date | Status | Borrower | Loan Amount |
|---|---|---|---|
| Previous Owner | Handy Priscilla | $189,000 |
Source: Public Records
Tax History Compared to Growth
Tax History
| Year | Tax Paid | Tax Assessment Tax Assessment Total Assessment is a certain percentage of the fair market value that is determined by local assessors to be the total taxable value of land and additions on the property. | Land | Improvement |
|---|---|---|---|---|
| 2025 | $4,413 | $285,715 | $51,000 | $234,715 |
| 2024 | $6,820 | $293,539 | $58,875 | $234,664 |
| 2023 | $4,418 | $298,029 | $39,000 | $259,029 |
| 2022 | $6,496 | $273,419 | $39,000 | $234,419 |
| 2021 | $4,980 | $197,471 | $19,950 | $177,521 |
| 2020 | $3,492 | $132,380 | $15,000 | $117,380 |
| 2019 | $3,476 | $126,338 | $8,550 | $117,788 |
| 2018 | $3,371 | $121,512 | $7,275 | $114,237 |
| 2017 | $2,527 | $90,331 | $3,000 | $87,331 |
| 2016 | $2,623 | $93,754 | $2,700 | $91,054 |
| 2015 | $2,373 | $84,015 | $3,150 | $80,865 |
| 2014 | $2,454 | $86,862 | $3,150 | $83,712 |
Source: Public Records
Map
Nearby Homes
- 830 W Shepherd St
- 904 W Shepherd St
- 919 W Day St
- 920 W Morgan St
- 901 W Munson St
- 702 S Barrett Ave
- 1109 S Chandler Ave
- 831 W Owing St
- 826 W Crawford St
- 1131 W Shepherd St
- 621 W Munson St
- 1007 S Scullin Ave
- 1127 W Morgan St
- 1011 S Armstrong Ave
- 701 W Hull St Unit 101-2
- 1217 W Nelson St
- 1027 W Crawford St
- 1224 W Nelson St
- 704 W Hull St
- 705 W Crawford St
- 909 W Shepherd St
- 901 W Shepherd St
- 915 W Shepherd St
- 611 S Scullin Ave
- 917 W Shepherd St
- 831 W Shepherd St
- 906 W Nelson St
- 900 W Nelson St
- 912 W Nelson St
- 923 W Shepherd St
- 829 W Shepherd St
- 918 W Nelson St
- 900 W Shepherd St
- 908 W Shepherd St
- 830 W Nelson St
- 914 W Shepherd St
- 925 W Shepherd St
- 918 W Shepherd St
- 922 W Nelson St
- 823 W Shepherd St