905 Whistling Swan Dr Unit 905 Virginia Beach, VA 23464
Estimated Value: $197,000 - $207,000
2
Beds
2
Baths
1,000
Sq Ft
$201/Sq Ft
Est. Value
About This Home
This home is located at 905 Whistling Swan Dr Unit 905, Virginia Beach, VA 23464 and is currently estimated at $200,936, approximately $200 per square foot. 905 Whistling Swan Dr Unit 905 is a home located in Virginia Beach City with nearby schools including Woodstock Elementary School, Kempsville Middle School, and Tallwood High School.
Ownership History
Date
Name
Owned For
Owner Type
Purchase Details
Closed on
Jul 5, 2012
Sold by
Ward Norman E
Bought by
Smith Margaret A
Current Estimated Value
Home Financials for this Owner
Home Financials are based on the most recent Mortgage that was taken out on this home.
Original Mortgage
$93,172
Outstanding Balance
$63,395
Interest Rate
3.37%
Mortgage Type
FHA
Estimated Equity
$137,541
Purchase Details
Closed on
Dec 2, 2003
Sold by
Clark Sean E
Bought by
Ward Meredith M
Home Financials for this Owner
Home Financials are based on the most recent Mortgage that was taken out on this home.
Original Mortgage
$68,160
Interest Rate
6.09%
Mortgage Type
New Conventional
Purchase Details
Closed on
Dec 14, 1999
Sold by
Mulberry Corp
Bought by
Clark Sean E
Home Financials for this Owner
Home Financials are based on the most recent Mortgage that was taken out on this home.
Original Mortgage
$59,750
Interest Rate
7.81%
Create a Home Valuation Report for This Property
The Home Valuation Report is an in-depth analysis detailing your home's value as well as a comparison with similar homes in the area
Home Values in the Area
Average Home Value in this Area
Purchase History
| Date | Buyer | Sale Price | Title Company |
|---|---|---|---|
| Smith Margaret A | $95,000 | -- | |
| Ward Meredith M | $85,200 | -- | |
| Clark Sean E | $62,900 | -- |
Source: Public Records
Mortgage History
| Date | Status | Borrower | Loan Amount |
|---|---|---|---|
| Open | Smith Margaret A | $93,172 | |
| Previous Owner | Ward Meredith M | $68,160 | |
| Previous Owner | Clark Sean E | $59,750 |
Source: Public Records
Tax History Compared to Growth
Tax History
| Year | Tax Paid | Tax Assessment Tax Assessment Total Assessment is a certain percentage of the fair market value that is determined by local assessors to be the total taxable value of land and additions on the property. | Land | Improvement |
|---|---|---|---|---|
| 2025 | $1,734 | $179,900 | $61,500 | $118,400 |
| 2024 | $1,734 | $178,800 | $61,500 | $117,300 |
| 2023 | $1,481 | $149,600 | $56,000 | $93,600 |
| 2022 | $1,287 | $130,000 | $47,000 | $83,000 |
| 2021 | $1,009 | $101,900 | $27,000 | $74,900 |
| 2020 | $953 | $93,700 | $27,000 | $66,700 |
| 2019 | $911 | $88,000 | $27,000 | $61,000 |
| 2018 | $882 | $88,000 | $27,000 | $61,000 |
| 2017 | $906 | $90,400 | $28,000 | $62,400 |
| 2016 | $836 | $84,400 | $25,000 | $59,400 |
| 2015 | $743 | $75,000 | $23,400 | $51,600 |
| 2014 | $859 | $81,900 | $29,300 | $52,600 |
Source: Public Records
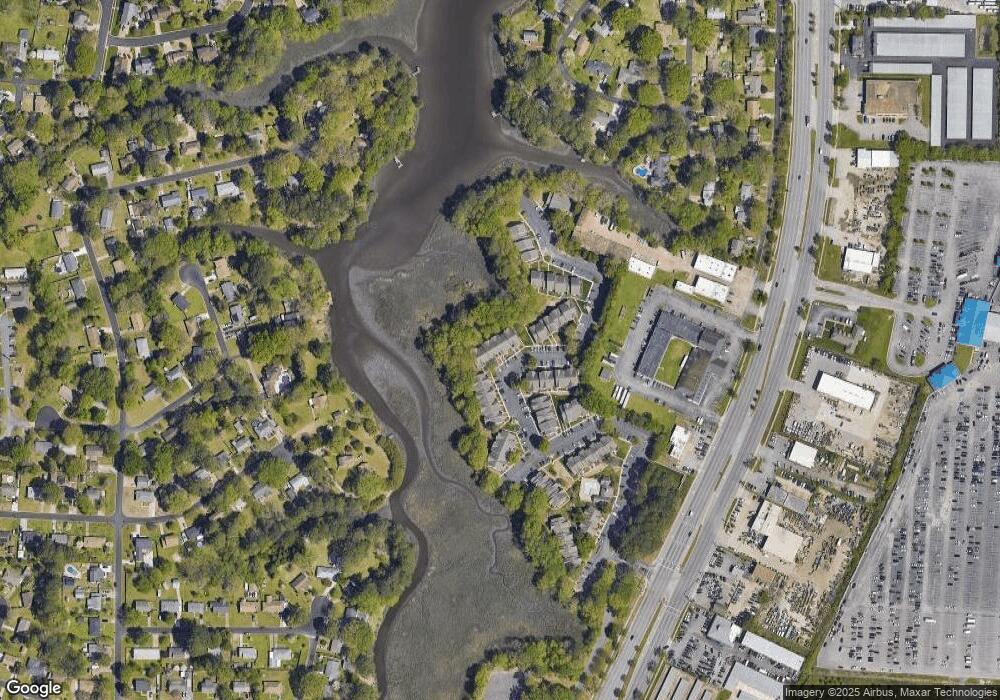
Map
Nearby Homes
- 897 Whistling Swan Dr
- 1041 Pebblewood Dr
- 877 Whistling Swan Dr
- 824 Whistling Swan Dr
- 801 Kings Creek Dr
- 605 S Military Hwy
- 3396 Monticello Dr
- 1025 Sherry Ave
- 924 Trestman Ave
- 3141 Manatee Dr
- 969 Sunnyside Dr
- 3425 Glen Arden Rd
- 729 Howell St
- 3124 Choctaw Dr
- 1020 Emporia Ave
- 1017 Sunnyside Dr
- 808 Raymond Ct
- 1012 Towanda Rd
- 940 Westerly Trail
- 952 Redwood Cir
- 905 Whistling Swan Dr
- 925 Whistling Swan Dr
- 937 Whistling Swan Dr
- 929 Whistling Swan Dr
- 889 Whistling Swan Dr
- 901 Whistling Swan Dr
- 921 Whistling Swan Dr
- 933 Whistling Swan Dr
- 917 Whistling Swan Dr
- 885 Whistling Swan Dr
- 909 Whistling Swan Dr
- 1033 Pebblewood Dr
- 1001 Pebblewood Dr
- 1037 Pebblewood Dr
- 913 Whistling Swan Dr
- 881 Whistling Swan Dr
- 1005 Pebblewood Dr
- 1045 Pebblewood Dr
- 1009 Pebblewood Dr
- 1053 Pebblewood Dr