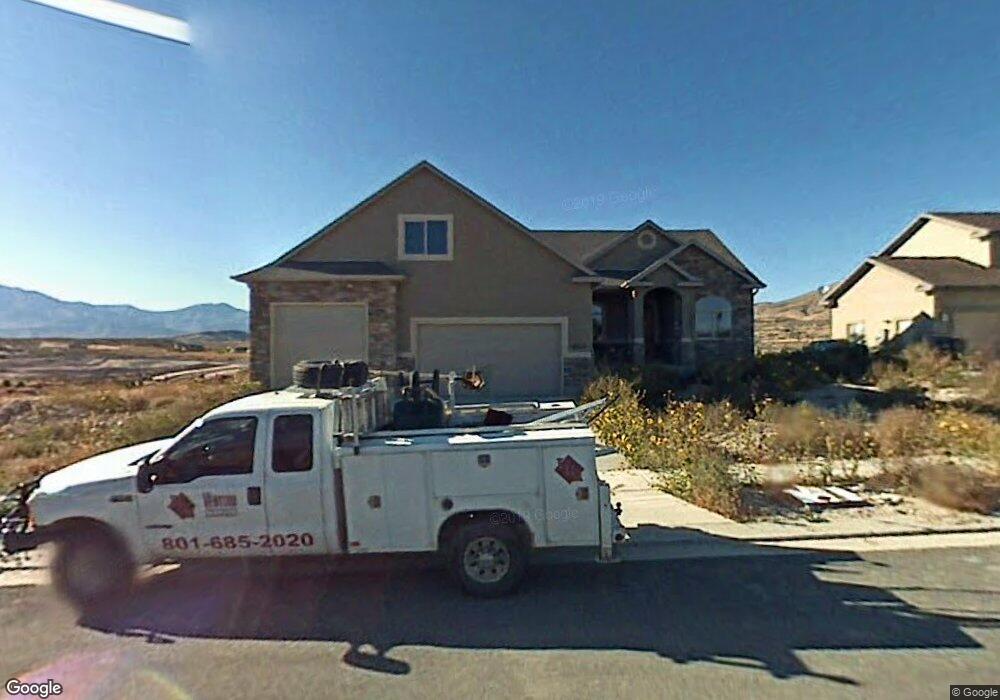
9055 Torrey Pines Loop Eagle Mountain, UT 84005
Estimated Value: $636,000 - $765,000
4
Beds
2
Baths
3,976
Sq Ft
$175/Sq Ft
Est. Value
About This Home
This home is located at 9055 Torrey Pines Loop, Eagle Mountain, UT 84005 and is currently estimated at $693,887, approximately $174 per square foot. 9055 Torrey Pines Loop is a home located in Utah County with nearby schools including Pony Express Elementary School, Frontier Middle School, and Cedar Valley High.
Ownership History
Date
Name
Owned For
Owner Type
Purchase Details
Closed on
May 20, 2009
Sold by
Viper Properties Llc
Bought by
Fenn Joshua P
Current Estimated Value
Home Financials for this Owner
Home Financials are based on the most recent Mortgage that was taken out on this home.
Original Mortgage
$240,070
Outstanding Balance
$150,618
Interest Rate
4.8%
Mortgage Type
FHA
Estimated Equity
$543,269
Purchase Details
Closed on
Mar 5, 2008
Sold by
Arnold Lee A
Bought by
Viper Properties Llc
Purchase Details
Closed on
Mar 7, 2006
Sold by
Pelton Russell and Pelton Carolyn
Bought by
Arnold Lee A
Home Financials for this Owner
Home Financials are based on the most recent Mortgage that was taken out on this home.
Original Mortgage
$215,170
Interest Rate
6.08%
Mortgage Type
Purchase Money Mortgage
Purchase Details
Closed on
Oct 17, 2002
Sold by
The Ranches Lc
Bought by
Wells Fargo Bank Northwest Na and First Security Bank Na
Create a Home Valuation Report for This Property
The Home Valuation Report is an in-depth analysis detailing your home's value as well as a comparison with similar homes in the area
Home Values in the Area
Average Home Value in this Area
Purchase History
| Date | Buyer | Sale Price | Title Company |
|---|---|---|---|
| Fenn Joshua P | -- | Canyon View Title Insurance | |
| Viper Properties Llc | -- | Excel Title Insurance Agenc | |
| Arnold Lee A | -- | Integrated Title Insurance | |
| Wells Fargo Bank Northwest Na | $1,100,000 | First American Title Co |
Source: Public Records
Mortgage History
| Date | Status | Borrower | Loan Amount |
|---|---|---|---|
| Open | Fenn Joshua P | $240,070 | |
| Previous Owner | Arnold Lee A | $215,170 |
Source: Public Records
Tax History
| Year | Tax Paid | Tax Assessment Tax Assessment Total Assessment is a certain percentage of the fair market value that is determined by local assessors to be the total taxable value of land and additions on the property. | Land | Improvement |
|---|---|---|---|---|
| 2025 | $2,908 | $353,320 | -- | -- |
| 2024 | $2,908 | $314,215 | $0 | $0 |
| 2023 | $2,775 | $323,785 | $0 | $0 |
| 2022 | $2,813 | $320,705 | $0 | $0 |
| 2021 | $2,470 | $422,600 | $128,700 | $293,900 |
| 2020 | $2,351 | $392,600 | $119,200 | $273,400 |
| 2019 | $2,166 | $374,800 | $106,400 | $268,400 |
| 2018 | $2,160 | $353,600 | $106,400 | $247,200 |
| 2017 | $2,086 | $183,700 | $0 | $0 |
| 2016 | $2,043 | $168,410 | $0 | $0 |
| 2015 | $2,120 | $165,660 | $0 | $0 |
| 2014 | $1,893 | $146,080 | $0 | $0 |
Source: Public Records
Map
Nearby Homes
- 2989 N Lone Pine St Unit 633
- 3006 N Lone Pine St Unit 642
- 3019 Lone Pine St N Unit 636
- 2996 N Lone Pine St Unit 643
- 9039 N Mount Airey Dr
- 3887 E Clubhouse Ln
- 9021 N Clubhouse Ln
- 8984 E Skye Loop
- 9225 N Mount Airey Dr
- 4097 E Clubhouse Ln
- 3867 E Cunninghill Dr
- 3843 E Cunninghill Dr
- 806 N Somerset Aly Unit 5
- 3846 E Cunninghill Dr
- 8675 N Franklin Dr
- 9142 N Kilkenny Way
- 8680 N Shadow Creek Aly
- 3552 E Aster Dr
- 3772 E Cunninghill Dr
- 9579 N Bluebell Dr
- 9055 Torrey Pines Loop Unit 10
- 9069 Torrey Pines Loop
- 9069 Torrey Pines Loop Unit 11
- 9041 N Torrey Pines Loop Unit 9
- 9041 N Torrey Pines Loop Unit 9
- 9029 Torrey Pines Loop
- 3082 Lone Pine St
- 2997 N Lone Pine St Unit 634
- 9058 Torrey Pines Loop
- 9058 Torrey Pines Loop Unit 43
- 9058 N Torrey Pines Loop Unit 43
- 9048 Torrey Pines Loop
- 9048 Torrey Pines Loop Unit 44
- 9048 N Torrey Pines Loop
- 9029 Torrey Pines Loop
- 9029 Torrey Pines Loop Unit 8
- 9078 N Torrey Pines Loop Unit 41
- 9073 N Torrey Pines Loop
- 9072 N Torrey Pines Loop Unit 42
- 9072 N Torrey Pines Loop
Your Personal Tour Guide
Ask me questions while you tour the home.