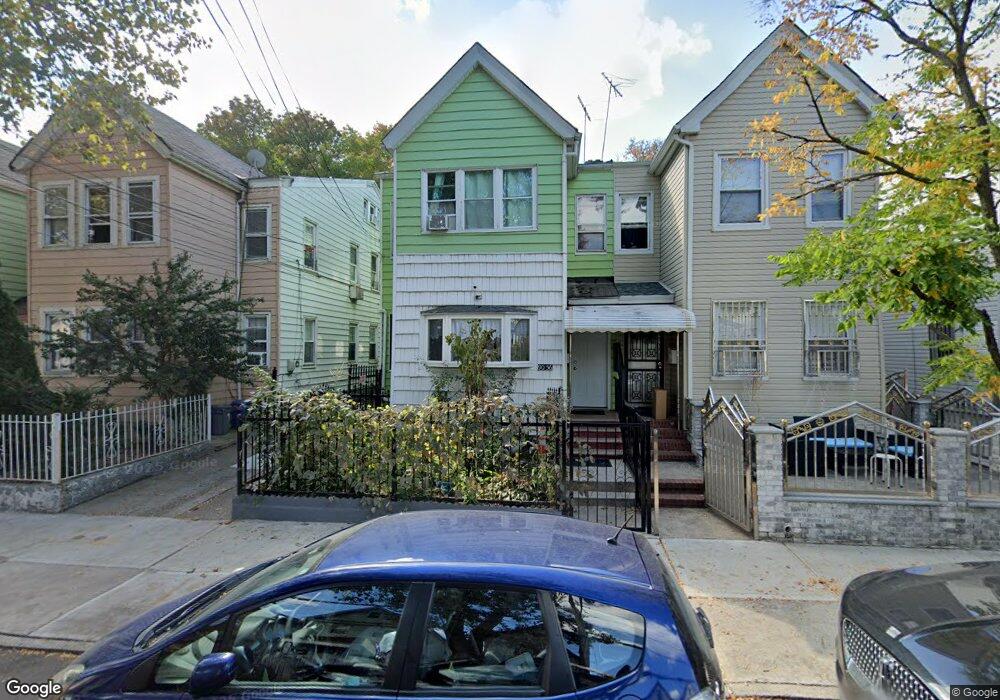
9056 180th St Jamaica, NY 11432
Jamaica NeighborhoodEstimated Value: $988,549 - $1,080,000
--
Bed
--
Bath
1,950
Sq Ft
$528/Sq Ft
Est. Value
About This Home
This home is located at 9056 180th St, Jamaica, NY 11432 and is currently estimated at $1,030,137, approximately $528 per square foot. 9056 180th St is a home located in Queens County with nearby schools including P.S. 95 - Eastwood, I.S. 238 Susan B Anthony Academy, and Immaculate Conception Catholic Academy.
Ownership History
Date
Name
Owned For
Owner Type
Purchase Details
Closed on
Apr 28, 2011
Sold by
Naraine Jasodai and Naraine Mahendra Persaud
Bought by
Naraine Jasodai and Naraine Mahendra Persaud
Current Estimated Value
Purchase Details
Closed on
Jun 11, 2010
Sold by
Naraine Mahendra Persaud and Naraine Parmanand
Bought by
Naraine Jasodai and Naraine Mahendra Persaud
Purchase Details
Closed on
Dec 19, 2003
Sold by
Ramphul Oree
Bought by
Naraine Mahendra Persaud and Naraine Parmanand
Home Financials for this Owner
Home Financials are based on the most recent Mortgage that was taken out on this home.
Original Mortgage
$413,100
Interest Rate
5.67%
Mortgage Type
Purchase Money Mortgage
Purchase Details
Closed on
Mar 16, 1995
Sold by
Ramphul Oree and Ramphul Suresh C
Bought by
Ramphul Oree
Create a Home Valuation Report for This Property
The Home Valuation Report is an in-depth analysis detailing your home's value as well as a comparison with similar homes in the area
Home Values in the Area
Average Home Value in this Area
Purchase History
| Date | Buyer | Sale Price | Title Company |
|---|---|---|---|
| Naraine Jasodai | -- | -- | |
| Naraine Jasodai | -- | -- | |
| Naraine Jasodai | -- | -- | |
| Naraine Jasodai | -- | -- | |
| Naraine Mahendra Persaud | $440,000 | -- | |
| Naraine Mahendra Persaud | $440,000 | -- | |
| Ramphul Oree | -- | Commonwealth Land Title Ins | |
| Ramphul Oree | -- | Commonwealth Land Title Ins |
Source: Public Records
Mortgage History
| Date | Status | Borrower | Loan Amount |
|---|---|---|---|
| Previous Owner | Naraine Mahendra Persaud | $413,100 |
Source: Public Records
Tax History Compared to Growth
Tax History
| Year | Tax Paid | Tax Assessment Tax Assessment Total Assessment is a certain percentage of the fair market value that is determined by local assessors to be the total taxable value of land and additions on the property. | Land | Improvement |
|---|---|---|---|---|
| 2025 | $7,516 | $38,189 | $11,526 | $26,663 |
| 2024 | $7,516 | $37,422 | $12,146 | $25,276 |
| 2023 | $7,182 | $35,756 | $10,734 | $25,022 |
| 2022 | $6,734 | $50,280 | $17,040 | $33,240 |
| 2021 | $6,697 | $47,340 | $17,040 | $30,300 |
| 2020 | $6,736 | $45,480 | $17,040 | $28,440 |
| 2019 | $6,524 | $38,940 | $17,040 | $21,900 |
| 2018 | $6,074 | $29,797 | $13,518 | $16,279 |
| 2017 | $5,730 | $28,111 | $13,531 | $14,580 |
| 2016 | $5,302 | $28,111 | $13,531 | $14,580 |
| 2015 | $3,209 | $27,547 | $18,060 | $9,487 |
| 2014 | $3,209 | $25,988 | $16,624 | $9,364 |
Source: Public Records
Map
Nearby Homes
- 9037 180th St
- 91-14 182nd St
- 182-04 91st Ave
- 90-11 179th St
- 91-19 182nd St
- 9071 178th St
- 9041 178th St
- 90-29 178th St
- 91-28 182nd Place
- 8908 182nd St
- 90-43 176th St
- 8918 182nd Place
- 181-18 93rd Ave
- 177 E 93rd St Unit 3B
- 8830 182nd St Unit 1E
- 88-30 182nd St Unit 1H
- 88-30 182nd St Unit 4D
- 8830 182nd St Unit 3F
- 175-26 89th Ave Unit D
- 8931 184th St