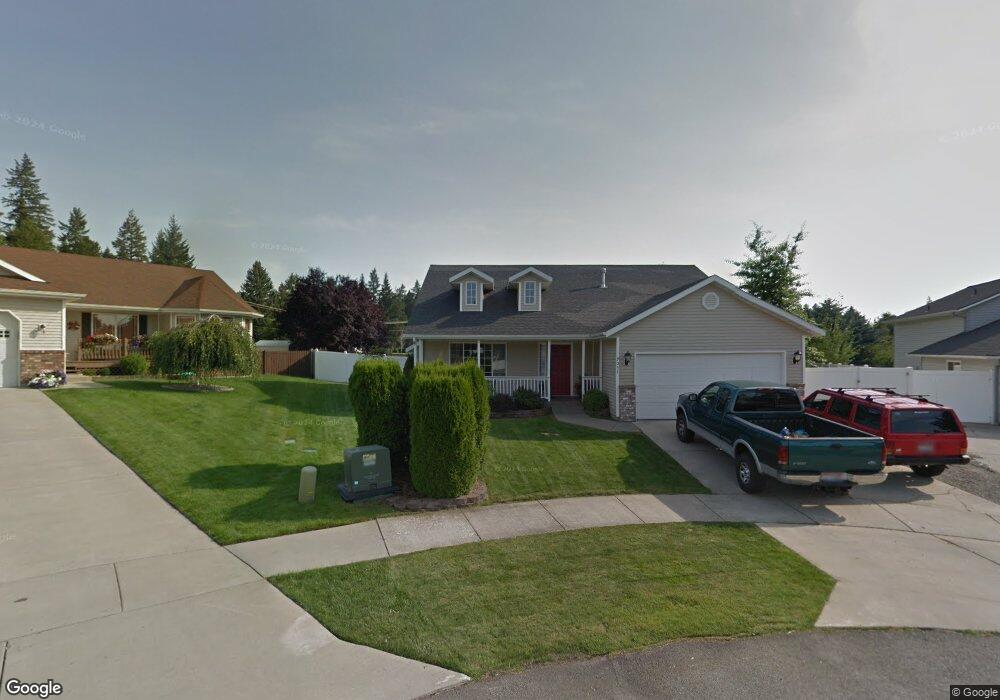
9057 N Drawbridge Ct Hayden, ID 83835
Estimated Value: $611,346 - $708,000
4
Beds
3
Baths
1,932
Sq Ft
$332/Sq Ft
Est. Value
About This Home
This home is located at 9057 N Drawbridge Ct, Hayden, ID 83835 and is currently estimated at $642,087, approximately $332 per square foot. 9057 N Drawbridge Ct is a home located in Kootenai County with nearby schools including Hayden Meadows Elementary School, Canfield Middle School, and Coeur d'Alene High School.
Ownership History
Date
Name
Owned For
Owner Type
Purchase Details
Closed on
Sep 15, 2020
Sold by
Gammoh Fuad J and Gammoh Starla S
Bought by
Toering Allyn C and Johns Richard R
Current Estimated Value
Home Financials for this Owner
Home Financials are based on the most recent Mortgage that was taken out on this home.
Original Mortgage
$110,000
Outstanding Balance
$97,437
Interest Rate
2.8%
Mortgage Type
New Conventional
Estimated Equity
$544,650
Purchase Details
Closed on
Jul 18, 2018
Sold by
Weed Paul and Weed Leah
Bought by
Gammoh Fuad J and Gammoh Starla S
Purchase Details
Closed on
Jun 26, 2015
Sold by
Gauger Aaron M and Gauger Lena R
Bought by
Weed Paul and Weed Leah
Home Financials for this Owner
Home Financials are based on the most recent Mortgage that was taken out on this home.
Original Mortgage
$210,090
Interest Rate
3.81%
Mortgage Type
Seller Take Back
Create a Home Valuation Report for This Property
The Home Valuation Report is an in-depth analysis detailing your home's value as well as a comparison with similar homes in the area
Home Values in the Area
Average Home Value in this Area
Purchase History
| Date | Buyer | Sale Price | Title Company |
|---|---|---|---|
| Toering Allyn C | -- | Titleone Boise | |
| Gammoh Fuad J | -- | Alliance Title & Escrow Corp | |
| Weed Paul | -- | Alliance Title Coeur D Alene |
Source: Public Records
Mortgage History
| Date | Status | Borrower | Loan Amount |
|---|---|---|---|
| Open | Toering Allyn C | $110,000 | |
| Previous Owner | Weed Paul | $210,090 |
Source: Public Records
Tax History Compared to Growth
Tax History
| Year | Tax Paid | Tax Assessment Tax Assessment Total Assessment is a certain percentage of the fair market value that is determined by local assessors to be the total taxable value of land and additions on the property. | Land | Improvement |
|---|---|---|---|---|
| 2024 | $1,842 | $557,605 | $205,000 | $352,605 |
| 2023 | $1,842 | $580,043 | $205,000 | $375,043 |
| 2022 | $2,199 | $622,866 | $235,000 | $387,866 |
| 2021 | $1,965 | $396,857 | $140,000 | $256,857 |
| 2020 | $1,311 | $353,015 | $132,000 | $221,015 |
| 2019 | $1,942 | $317,430 | $120,000 | $197,430 |
| 2018 | $1,475 | $244,980 | $113,000 | $131,980 |
| 2017 | $1,353 | $223,320 | $94,380 | $128,940 |
| 2016 | $1,315 | $209,510 | $85,800 | $123,710 |
| 2015 | $2,307 | $203,930 | $78,000 | $125,930 |
| 2013 | $1,012 | $159,470 | $46,000 | $113,470 |
Source: Public Records
Map
Nearby Homes
- 1268 E Woodstone Ct
- 9262 N Secretariat Ln
- 2484 E Woodstone Dr
- 985 E Loch Lomond Ct
- 623 E Maple Place
- 8533 N Tartan Dr
- 1692 E Pebblestone Ct
- 8562 N Audubon Dr
- 536 E Cloverleaf Dr
- 8698 N Woodvine Dr
- 9754 N Ptarmigan Dr
- 2060 E Woodstone Dr
- 769 E Southwood Ct
- 8323 N Tartan Dr
- 8385 N Selkirk Ct
- 9603 N Strahorn Rd
- 9384 N Baack St
- 8351 N Audubon Dr
- 9032 N Cuff Rd
- 1627 Northwood Dr
- 9059 N Drawbridge Ct
- 9053 N Drawbridge Ct
- 9069 N Drawbridge Ct
- 9051 N Drawbridge Ct
- 9091 N Drawbridge Ct
- 9064 N Finucane Dr
- nna Castleway
- 9101 N Castle Way
- 9094 N Finucane Dr
- 9121 N Drawbridge Ct
- 9006 N Finucane Dr
- 9098 N Castle Way
- 9121 N Castle Way
- 9142 N Drawbridge Ct
- 9126 N Finucane Dr
- 9118 N Castle Way
- 9151 N Drawbridge Ct
- 1255 E Woodstone Ct
- 1255 E Woodstone Ct
- 9166 N Drawbridge Ct