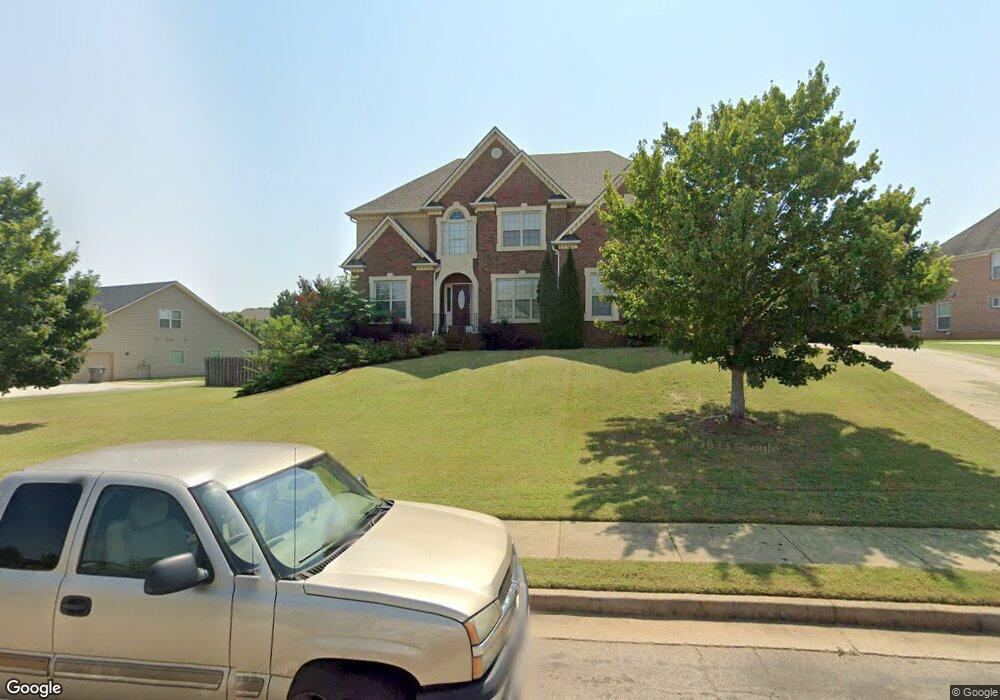
9059 Dawes Crossing Unit 2 McDonough, GA 30252
Estimated Value: $458,174 - $567,000
5
Beds
4
Baths
3,493
Sq Ft
$148/Sq Ft
Est. Value
About This Home
This home is located at 9059 Dawes Crossing Unit 2, McDonough, GA 30252 and is currently estimated at $516,794, approximately $147 per square foot. 9059 Dawes Crossing Unit 2 is a home located in Henry County with nearby schools including Tussahaw Elementary School, Locust Grove Middle School, and Locust Grove High School.
Ownership History
Date
Name
Owned For
Owner Type
Purchase Details
Closed on
Jun 28, 2013
Sold by
Secretary Of Veterans Affa
Bought by
Myrick Kevin A and Myrick Alicia S
Current Estimated Value
Home Financials for this Owner
Home Financials are based on the most recent Mortgage that was taken out on this home.
Original Mortgage
$198,550
Outstanding Balance
$143,108
Interest Rate
3.79%
Mortgage Type
New Conventional
Estimated Equity
$373,686
Purchase Details
Closed on
Jan 2, 2013
Sold by
Bank Of America Na
Bought by
Secretary Of Veterans Affairs
Purchase Details
Closed on
Oct 31, 2007
Sold by
David Martin Hms Inc
Bought by
Harris Angela M
Home Financials for this Owner
Home Financials are based on the most recent Mortgage that was taken out on this home.
Original Mortgage
$368,900
Interest Rate
6.27%
Mortgage Type
VA
Create a Home Valuation Report for This Property
The Home Valuation Report is an in-depth analysis detailing your home's value as well as a comparison with similar homes in the area
Home Values in the Area
Average Home Value in this Area
Purchase History
| Date | Buyer | Sale Price | Title Company |
|---|---|---|---|
| Myrick Kevin A | $209,000 | -- | |
| Secretary Of Veterans Affairs | $179,785 | -- | |
| Bank Of America Na | $179,785 | -- | |
| Harris Angela M | $368,900 | -- |
Source: Public Records
Mortgage History
| Date | Status | Borrower | Loan Amount |
|---|---|---|---|
| Open | Myrick Kevin A | $198,550 | |
| Previous Owner | Harris Angela M | $368,900 |
Source: Public Records
Tax History Compared to Growth
Tax History
| Year | Tax Paid | Tax Assessment Tax Assessment Total Assessment is a certain percentage of the fair market value that is determined by local assessors to be the total taxable value of land and additions on the property. | Land | Improvement |
|---|---|---|---|---|
| 2025 | $5,630 | $198,264 | $28,000 | $170,264 |
| 2024 | $5,630 | $200,440 | $28,000 | $172,440 |
| 2023 | $5,272 | $198,240 | $29,400 | $168,840 |
| 2022 | $5,515 | $187,160 | $29,400 | $157,760 |
| 2021 | $4,554 | $146,480 | $24,000 | $122,480 |
| 2020 | $4,421 | $140,840 | $19,400 | $121,440 |
| 2019 | $4,397 | $139,840 | $18,800 | $121,040 |
| 2018 | $3,855 | $116,920 | $16,800 | $100,120 |
| 2016 | $3,589 | $105,640 | $15,800 | $89,840 |
| 2015 | $3,599 | $102,400 | $10,400 | $92,000 |
| 2014 | $3,138 | $83,600 | $11,370 | $72,230 |
Source: Public Records
Map
Nearby Homes
- 9054 Dawes Crossing
- 8008 Revere Dr Unit 1
- 167 Classica Dr
- 3227 Puritan Way
- 5120 Redcoat Ln
- 0 King Mill Rd Unit 10647914
- 0 King Mill Rd Unit 7684355
- 3305 Hancock Point
- 5009 Yankee Doodle Dr
- 435 Rabbit Run
- 206 Arthur Dr
- 437 Lancelot Trail
- 390 Coan Dr
- 1579 S Bethany Rd
- 103 Royal Way
- 224 Osier Dr
- 175 Osier Dr
- 450 Noblewood Dr
- 446 Noblewood Dr
- 435 Noblewood Dr
- 9059 Dawes Crossing
- 9063 Dawes Crossing Unit 2
- 9055 Dawes Crossing Unit 56
- 9055 Dawes Crossing
- 9051 Dawes Crossing
- 9051 Dawes Crossing Unit 55
- 9071 Dawes Crossing
- 9054 Dawes Crossing Unit LOT 28
- 9058 Dawes Crossing Unit LOT 29
- 9058 Dawes Crossing
- 9062 Dawes Crossing Unit LOT 30
- 9062 Dawes Crossing
- 9047 Dawes Crossing
- 9066 Dawes Crossing Unit 2031
- 9066 Dawes Crossing
- 9073 Dawes Crossing
- 9031 Dawes Crossing Unit 2050
- 9031 Dawes Crossing
- 9070 Dawes Crossing Unit 2
- 9050 Dawes Crossing