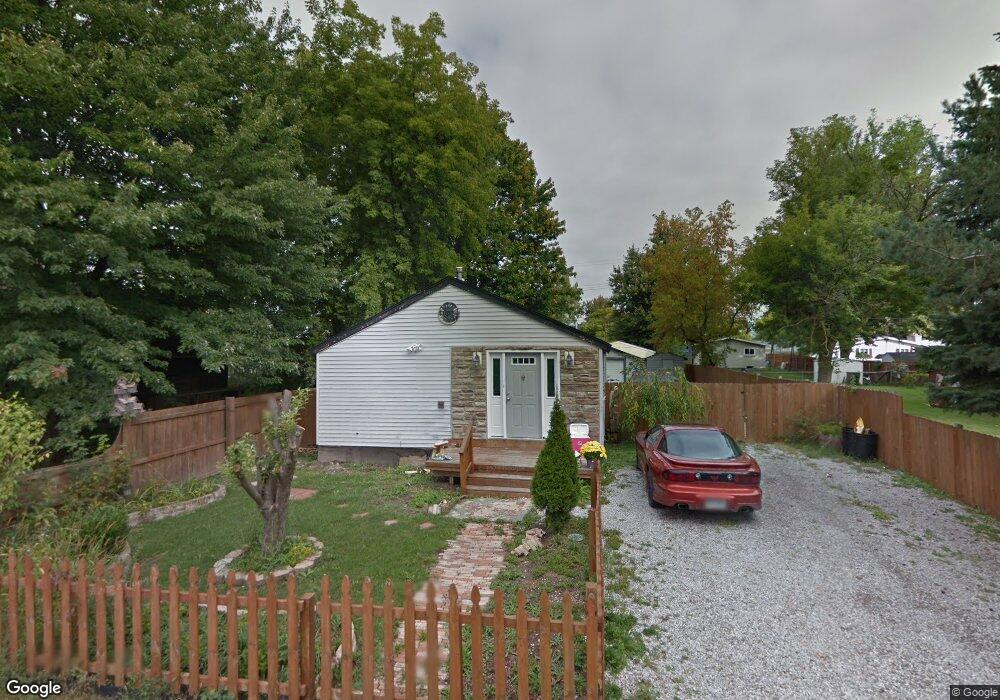
906 Carroll St Marine City, MI 48039
Estimated Value: $140,000 - $222,000
3
Beds
1
Bath
1,100
Sq Ft
$159/Sq Ft
Est. Value
About This Home
This home is located at 906 Carroll St, Marine City, MI 48039 and is currently estimated at $175,036, approximately $159 per square foot. 906 Carroll St is a home located in St. Clair County with nearby schools including Belle River Elementary School, Marine City Middle School, and Marine City High School.
Ownership History
Date
Name
Owned For
Owner Type
Purchase Details
Closed on
Jul 5, 2022
Sold by
Colgan Eric W
Bought by
Books Paul Nicholas
Current Estimated Value
Purchase Details
Closed on
Nov 20, 2012
Sold by
Colgan Eric W and Colgan Susan P
Bought by
Books Paul Nicholas
Purchase Details
Closed on
Aug 13, 2012
Sold by
Colgan Susan P
Bought by
Colgan Eric W and Colgan Susan P
Purchase Details
Closed on
Mar 8, 2007
Sold by
Biskner Richard Joseph and Bisker Anne Marie
Bought by
Deutsche Bank Natinal Trust Company
Create a Home Valuation Report for This Property
The Home Valuation Report is an in-depth analysis detailing your home's value as well as a comparison with similar homes in the area
Home Values in the Area
Average Home Value in this Area
Purchase History
| Date | Buyer | Sale Price | Title Company |
|---|---|---|---|
| Books Paul Nicholas | $55,000 | None Listed On Document | |
| Books Paul Nicholas | -- | None Available | |
| Colgan Eric W | -- | None Available | |
| Deutsche Bank Natinal Trust Company | $94,184 | None Available |
Source: Public Records
Tax History Compared to Growth
Tax History
| Year | Tax Paid | Tax Assessment Tax Assessment Total Assessment is a certain percentage of the fair market value that is determined by local assessors to be the total taxable value of land and additions on the property. | Land | Improvement |
|---|---|---|---|---|
| 2025 | $1,488 | $56,800 | $0 | $0 |
| 2024 | $761 | $55,100 | $0 | $0 |
| 2023 | $723 | $51,400 | $0 | $0 |
| 2022 | $1,387 | $41,200 | $0 | $0 |
| 2021 | $1,123 | $34,900 | $0 | $0 |
| 2020 | $1,123 | $30,100 | $30,100 | $0 |
| 2019 | $1,129 | $26,500 | $0 | $0 |
| 2018 | $1,345 | $26,100 | $0 | $0 |
| 2017 | $945 | $29,000 | $0 | $0 |
| 2016 | $478 | $29,000 | $0 | $0 |
| 2015 | -- | $28,300 | $28,300 | $0 |
| 2014 | -- | $25,900 | $25,900 | $0 |
| 2013 | -- | $25,200 | $0 | $0 |
Source: Public Records
Map
Nearby Homes