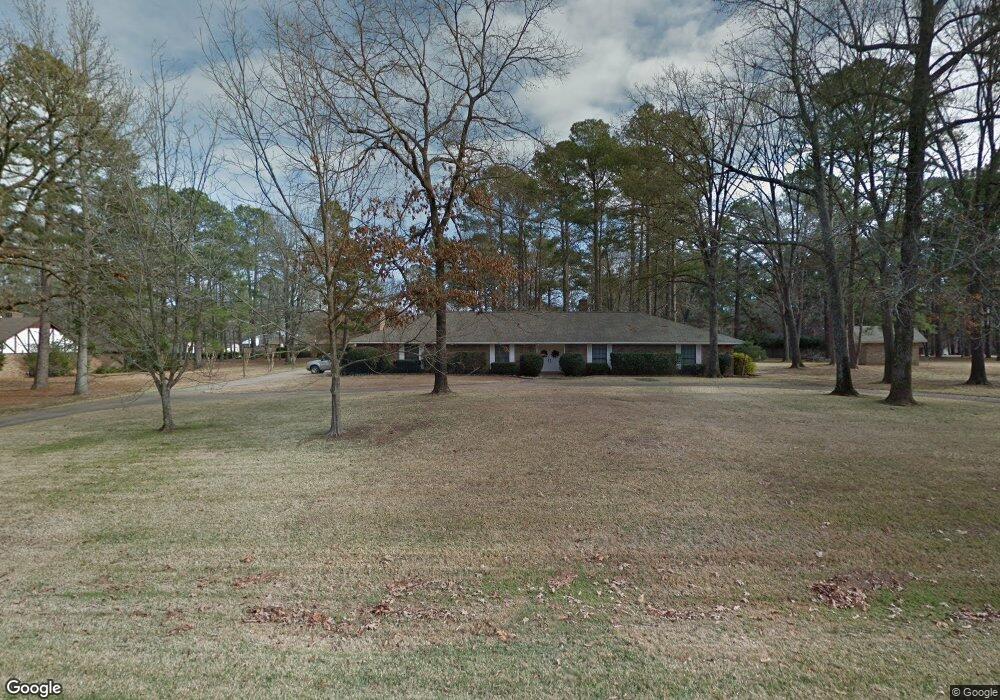
906 Clear Creek Dr Texarkana, TX 75503
Estimated Value: $365,967 - $451,000
--
Bed
--
Bath
3,308
Sq Ft
$123/Sq Ft
Est. Value
About This Home
This home is located at 906 Clear Creek Dr, Texarkana, TX 75503 and is currently estimated at $405,742, approximately $122 per square foot. 906 Clear Creek Dr is a home located in Bowie County with nearby schools including Margaret Fischer Davis Elementary School, Pleasant Grove Intermediate School, and Pleasant Grove Middle School.
Create a Home Valuation Report for This Property
The Home Valuation Report is an in-depth analysis detailing your home's value as well as a comparison with similar homes in the area
Home Values in the Area
Average Home Value in this Area
Tax History Compared to Growth
Tax History
| Year | Tax Paid | Tax Assessment Tax Assessment Total Assessment is a certain percentage of the fair market value that is determined by local assessors to be the total taxable value of land and additions on the property. | Land | Improvement |
|---|---|---|---|---|
| 2025 | $3,299 | $378,911 | $32,000 | $346,911 |
| 2024 | $3,299 | $348,137 | $32,000 | $333,889 |
| 2023 | $7,125 | $316,488 | $0 | $0 |
| 2022 | $7,065 | $310,517 | $32,000 | $278,517 |
| 2021 | $6,840 | $261,560 | $32,000 | $229,560 |
| 2020 | $6,680 | $254,102 | $32,000 | $222,102 |
| 2019 | $6,577 | $243,815 | $32,000 | $211,815 |
| 2018 | $6,407 | $238,846 | $32,000 | $206,846 |
| 2017 | $6,284 | $234,912 | $32,000 | $202,912 |
| 2016 | $6,131 | $229,206 | $32,000 | $197,206 |
| 2015 | $5,038 | $230,060 | $32,000 | $198,060 |
| 2014 | $5,038 | $228,193 | $32,000 | $196,193 |
Source: Public Records
Map
Nearby Homes
- 4 Holly Ridge Dr
- 604 Clear Creek Dr
- 26 Summer Ln
- 6301 Pecan Cove
- 918 Clear Creek Dr
- 3501 Clear Creek Cir
- 8 Wild Oak Cir
- 23 Holly Ridge Dr
- 3409 Williamsburg Ln
- 3407 Williamsburg Ln
- 6107 Ben Burrough Rd
- 6210 Gould Place
- 6106 Ben Burrough Rd
- 3703 Maplecrest St
- 3707 Maplecrest St
- 6137 Summerhill Place
- 6131 Summerhill Place
- 3108 Bethany Ln
- 3104 Bethany Ln
- 5904 Cooks Ln
- 908 Clear Creek Dr
- 1 Holly Ridge Dr
- 1 Holly Ridge Dr
- 5 Holly Ridge Dr
- 0 Holly Ridge Unit 17020823
- 3 Holly Ridge Dr
- 3 Holly Ridge
- 907 Clear Creek Dr
- 7 Holly Ridge Dr
- 909 Clear Creek Dr
- 910 Clear Creek Dr
- 9 Holly Ridge Dr
- 2 Holly Ridge Dr
- 911 Clear Creek Dr
- 2 Hickory Ridge Dr
- 3 Timberwilde St
- 6 Timberwilde St
- 8 Holly Ridge Dr
- 912 Clear Creek Dr
- 10 Holly Ridge Dr