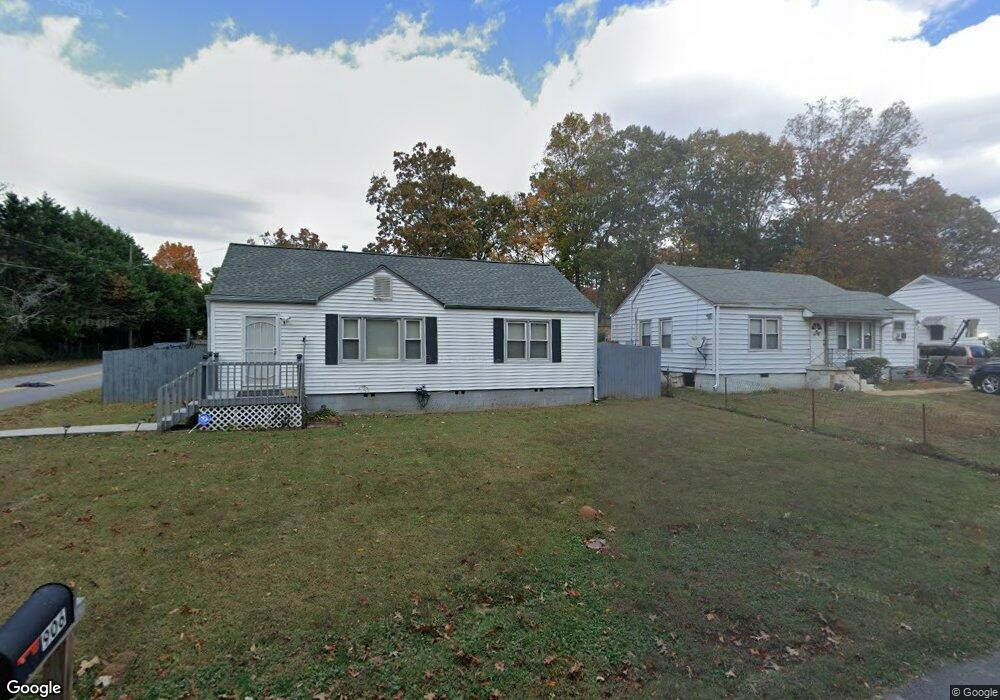
906 Dearing St Forest Park, GA 30297
Estimated Value: $123,000 - $142,623
2
Beds
1
Bath
920
Sq Ft
$147/Sq Ft
Est. Value
About This Home
This home is located at 906 Dearing St, Forest Park, GA 30297 and is currently estimated at $134,906, approximately $146 per square foot. 906 Dearing St is a home located in Clayton County with nearby schools including Lake City Elementary School, Babb Middle School, and Forest Park High School.
Ownership History
Date
Name
Owned For
Owner Type
Purchase Details
Closed on
Sep 1, 2015
Sold by
Swe Homes Ga Llc
Bought by
Baker Charles A
Current Estimated Value
Home Financials for this Owner
Home Financials are based on the most recent Mortgage that was taken out on this home.
Original Mortgage
$45,000
Outstanding Balance
$26,318
Interest Rate
3.94%
Mortgage Type
Commercial
Estimated Equity
$108,588
Purchase Details
Closed on
Apr 1, 2013
Sold by
Federal National Mortgage Association
Bought by
Swe Homes Ga Llc
Purchase Details
Closed on
Nov 26, 2012
Sold by
Jpmorgan Chase Bank Nation
Bought by
Federal National Mtg Associati
Purchase Details
Closed on
Nov 6, 2012
Sold by
May Cheryl E
Bought by
Jpmorgan Chase Bank National A
Purchase Details
Closed on
Apr 25, 1995
Sold by
Harper James A
Bought by
May Cheryl E
Create a Home Valuation Report for This Property
The Home Valuation Report is an in-depth analysis detailing your home's value as well as a comparison with similar homes in the area
Home Values in the Area
Average Home Value in this Area
Purchase History
| Date | Buyer | Sale Price | Title Company |
|---|---|---|---|
| Baker Charles A | $50,000 | -- | |
| Swe Homes Ga Llc | $13,150 | -- | |
| Federal National Mtg Associati | $67,986 | -- | |
| Jpmorgan Chase Bank National A | $67,986 | -- | |
| May Cheryl E | $43,500 | -- |
Source: Public Records
Mortgage History
| Date | Status | Borrower | Loan Amount |
|---|---|---|---|
| Open | Baker Charles A | $45,000 | |
| Closed | May Cheryl E | $0 |
Source: Public Records
Tax History Compared to Growth
Tax History
| Year | Tax Paid | Tax Assessment Tax Assessment Total Assessment is a certain percentage of the fair market value that is determined by local assessors to be the total taxable value of land and additions on the property. | Land | Improvement |
|---|---|---|---|---|
| 2025 | $1,231 | $54,160 | $7,200 | $46,960 |
| 2024 | $1,402 | $50,200 | $7,200 | $43,000 |
| 2023 | $1,514 | $47,360 | $7,200 | $40,160 |
| 2022 | $904 | $36,200 | $7,200 | $29,000 |
| 2021 | $363 | $4,000 | $4,000 | $16,441 |
| 2020 | $366 | $20,441 | $4,000 | $16,441 |
| 2019 | $372 | $20,441 | $4,000 | $16,441 |
| 2018 | $357 | $20,028 | $4,000 | $16,028 |
| 2017 | $167 | $14,688 | $4,000 | $10,688 |
| 2016 | $96 | $12,684 | $4,000 | $8,684 |
| 2015 | $508 | $0 | $0 | $0 |
| 2014 | $183 | $5,260 | $4,800 | $460 |
Source: Public Records
Map
Nearby Homes
- 791 Alice St
- 5012 East St
- 804 Linda Way
- 98 Werner Brook Way SW
- 5002 Park Ave
- 843 White Oak Dr
- 5068 Lorraine Place
- 718 South Ave
- 5344 Sharon St
- 5355 Sharon St
- 701 Forest Pkwy
- 888 Hill St
- 0 Hill St Unit 10563105
- 1167 Sanders Dr
- 1048 Ferguson Ct
- 5125 West St
- 0 Ash St Unit 10563129
- 946 Main St
- 904 Main St
- 575 Georgia Ave