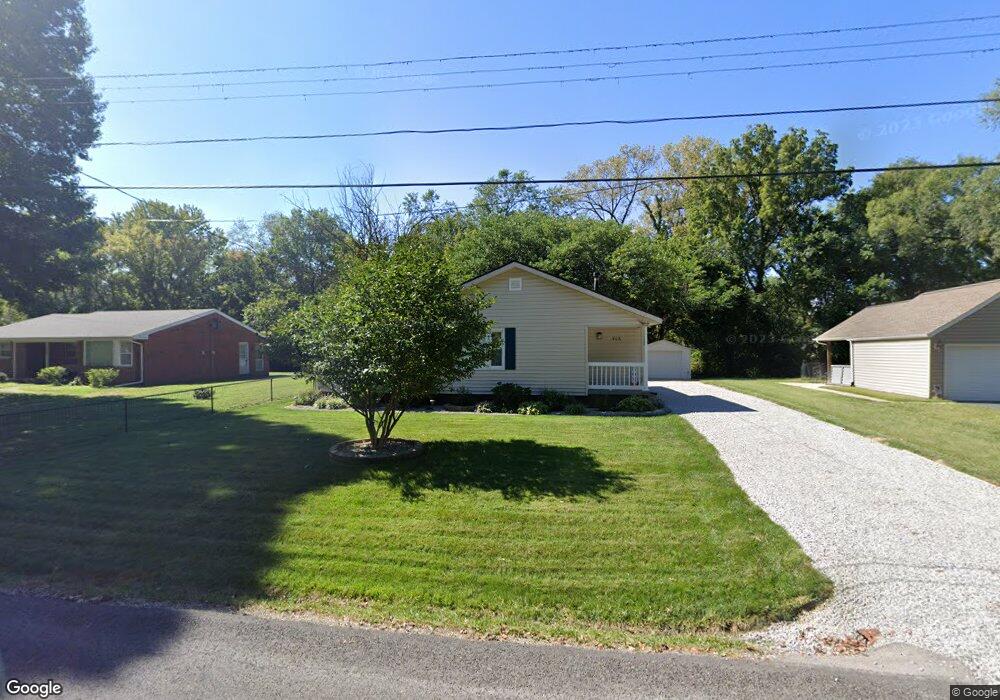
906 Dina Ave Collinsville, IL 62234
Estimated Value: $128,782 - $152,000
2
Beds
1
Bath
915
Sq Ft
$156/Sq Ft
Est. Value
About This Home
This home is located at 906 Dina Ave, Collinsville, IL 62234 and is currently estimated at $142,946, approximately $156 per square foot. 906 Dina Ave is a home located in St. Clair County with nearby schools including Twin Echo Elementary School, Dorris Intermediate School, and Collinsville Middle School.
Ownership History
Date
Name
Owned For
Owner Type
Purchase Details
Closed on
Aug 19, 2008
Sold by
Kuechle Mark and Kuechle Kelly
Bought by
Kilquist Paul D
Current Estimated Value
Home Financials for this Owner
Home Financials are based on the most recent Mortgage that was taken out on this home.
Original Mortgage
$91,136
Outstanding Balance
$60,079
Interest Rate
6.42%
Mortgage Type
VA
Estimated Equity
$82,867
Purchase Details
Closed on
May 6, 2005
Sold by
Jones Kevin E
Bought by
Kuechle Mark
Home Financials for this Owner
Home Financials are based on the most recent Mortgage that was taken out on this home.
Original Mortgage
$82,264
Interest Rate
6.13%
Mortgage Type
FHA
Purchase Details
Closed on
Jan 28, 2002
Sold by
Wyatt Linda Kay and Seymore Linda Kay
Bought by
Jones Kevin E
Home Financials for this Owner
Home Financials are based on the most recent Mortgage that was taken out on this home.
Original Mortgage
$63,000
Interest Rate
7.24%
Mortgage Type
Purchase Money Mortgage
Create a Home Valuation Report for This Property
The Home Valuation Report is an in-depth analysis detailing your home's value as well as a comparison with similar homes in the area
Home Values in the Area
Average Home Value in this Area
Purchase History
| Date | Buyer | Sale Price | Title Company |
|---|---|---|---|
| Kilquist Paul D | $89,000 | Abstracts & Titles Inc | |
| Kuechle Mark | $83,000 | Abstracts & Titles Inc | |
| Jones Kevin E | $63,000 | Abstracts & Titles Inc |
Source: Public Records
Mortgage History
| Date | Status | Borrower | Loan Amount |
|---|---|---|---|
| Open | Kilquist Paul D | $91,136 | |
| Previous Owner | Kuechle Mark | $82,264 | |
| Previous Owner | Jones Kevin E | $63,000 |
Source: Public Records
Tax History Compared to Growth
Tax History
| Year | Tax Paid | Tax Assessment Tax Assessment Total Assessment is a certain percentage of the fair market value that is determined by local assessors to be the total taxable value of land and additions on the property. | Land | Improvement |
|---|---|---|---|---|
| 2024 | $1,850 | $33,620 | $4,965 | $28,655 |
| 2023 | $1,660 | $29,747 | $4,393 | $25,354 |
| 2022 | $1,603 | $29,041 | $4,305 | $24,736 |
| 2021 | $1,555 | $27,564 | $4,086 | $23,478 |
| 2020 | $1,522 | $26,110 | $3,871 | $22,239 |
| 2019 | $1,471 | $26,110 | $3,871 | $22,239 |
| 2018 | $1,391 | $24,919 | $3,832 | $21,087 |
| 2017 | $1,390 | $23,909 | $3,677 | $20,232 |
| 2016 | $1,412 | $23,369 | $3,594 | $19,775 |
| 2014 | $1,260 | $22,744 | $2,147 | $20,597 |
| 2013 | $1,360 | $23,164 | $2,187 | $20,977 |
Source: Public Records
Map
Nearby Homes
- 115 Southwood Trace
- 714 Lillian St
- 1109 Saint Clair Ave
- Lot 20 Jefferson Ave
- Lot 36 Jefferson Ave
- Lot 37 Jefferson Ave
- Lot 38 Jefferson Ave
- 128 Courtland Place
- 116 Moffett Ave
- 114 Moffett Ave Unit 116
- Lot 32 Jefferson Ave
- 820 Bond Ave
- 208 Coral Dr
- 746 Maple St
- 202 Keeneland Ct
- 710 Saint Louis Rd
- 151 Helen Place
- 804 Carl St
- 11 Davis Place
- 126 Collinsville Ave