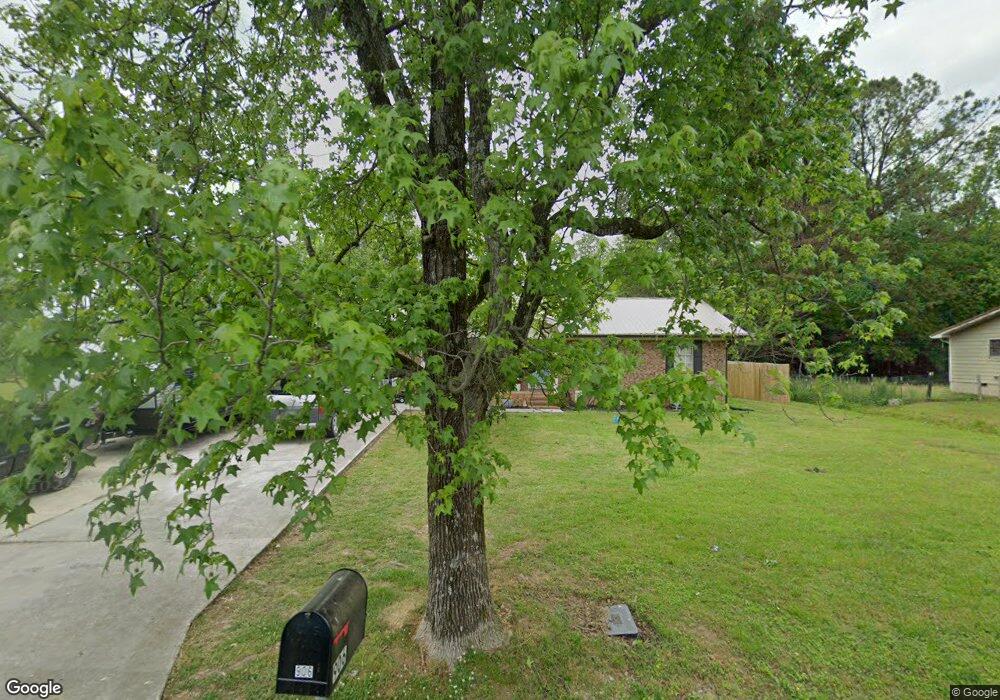
906 Evaline St La Fayette, GA 30728
Estimated Value: $187,000 - $205,000
3
Beds
2
Baths
1,446
Sq Ft
$135/Sq Ft
Est. Value
About This Home
This home is located at 906 Evaline St, La Fayette, GA 30728 and is currently estimated at $195,518, approximately $135 per square foot. 906 Evaline St is a home located in Walker County with nearby schools including North Lafayette Elementary School, Lafayette Middle School, and Lafayette High School.
Ownership History
Date
Name
Owned For
Owner Type
Purchase Details
Closed on
Apr 27, 2020
Sold by
Executor Chandler Greg
Bought by
Stoker Kaemdenne M
Current Estimated Value
Home Financials for this Owner
Home Financials are based on the most recent Mortgage that was taken out on this home.
Original Mortgage
$70,695
Outstanding Balance
$63,712
Interest Rate
4.25%
Mortgage Type
FHA
Estimated Equity
$131,806
Purchase Details
Closed on
Dec 7, 2016
Sold by
Lamar Richard
Bought by
Chandler Nina Robin Jackson
Purchase Details
Closed on
Sep 24, 1993
Sold by
Federal National Mortgage Ass
Bought by
Jackson Richard Lamar and Jackson Nina R
Purchase Details
Closed on
Aug 3, 1993
Sold by
Dendy Joel T and Dendy Beverly
Bought by
Federal National Mortgage Ass
Purchase Details
Closed on
Apr 19, 1988
Sold by
Robert Robert R and Robert Dorothy
Bought by
Dendy Joel T and Dendy Beverly
Purchase Details
Closed on
Jan 1, 1972
Bought by
Robert Robert R and Robert Dorothy
Create a Home Valuation Report for This Property
The Home Valuation Report is an in-depth analysis detailing your home's value as well as a comparison with similar homes in the area
Home Values in the Area
Average Home Value in this Area
Purchase History
| Date | Buyer | Sale Price | Title Company |
|---|---|---|---|
| Stoker Kaemdenne M | $72,000 | -- | |
| Chandler Nina Robin Jackson | -- | -- | |
| Jackson Richard Lamar | -- | -- | |
| Federal National Mortgage Ass | -- | -- | |
| Dendy Joel T | $46,500 | -- | |
| Robert Robert R | -- | -- |
Source: Public Records
Mortgage History
| Date | Status | Borrower | Loan Amount |
|---|---|---|---|
| Open | Stoker Kaemdenne M | $70,695 |
Source: Public Records
Tax History Compared to Growth
Tax History
| Year | Tax Paid | Tax Assessment Tax Assessment Total Assessment is a certain percentage of the fair market value that is determined by local assessors to be the total taxable value of land and additions on the property. | Land | Improvement |
|---|---|---|---|---|
| 2024 | $1,758 | $73,813 | $4,500 | $69,313 |
| 2023 | $1,720 | $70,069 | $4,500 | $65,569 |
| 2022 | $1,592 | $60,490 | $4,500 | $55,990 |
| 2021 | $1,271 | $43,296 | $4,500 | $38,796 |
| 2020 | $994 | $34,394 | $4,500 | $29,894 |
| 2019 | $994 | $34,394 | $4,500 | $29,894 |
| 2018 | $1,023 | $34,394 | $4,500 | $29,894 |
| 2017 | $1,084 | $34,394 | $4,500 | $29,894 |
| 2016 | $893 | $34,394 | $4,500 | $29,894 |
| 2015 | $898 | $33,043 | $5,000 | $28,043 |
| 2014 | $865 | $33,043 | $5,000 | $28,043 |
| 2013 | -- | $33,042 | $5,000 | $28,042 |
Source: Public Records
Map
Nearby Homes
- 0 Crest Dr Unit 10628988
- 0 Crest Dr Unit 1522720
- 216 Thurman St
- 27 Foster
- 1122 S Chattanooga St
- 906 S Chattanooga St
- 221 Chota Cir
- 805 Daugherty St
- 703 Bomar St
- 505 Mclemore St
- Curtis Plan at Lake Terrace
- Perry Plan at Lake Terrace
- Edmon Plan at Lake Terrace
- Lewis Plan at Lake Terrace
- Wyeth Plan at Lake Terrace
- Sullivan Plan at Lake Terrace
- 100 Lake Terrace Dr
- 307 S Duke St
- 78 Lake Terrace Dr
- 506 Daugherty St