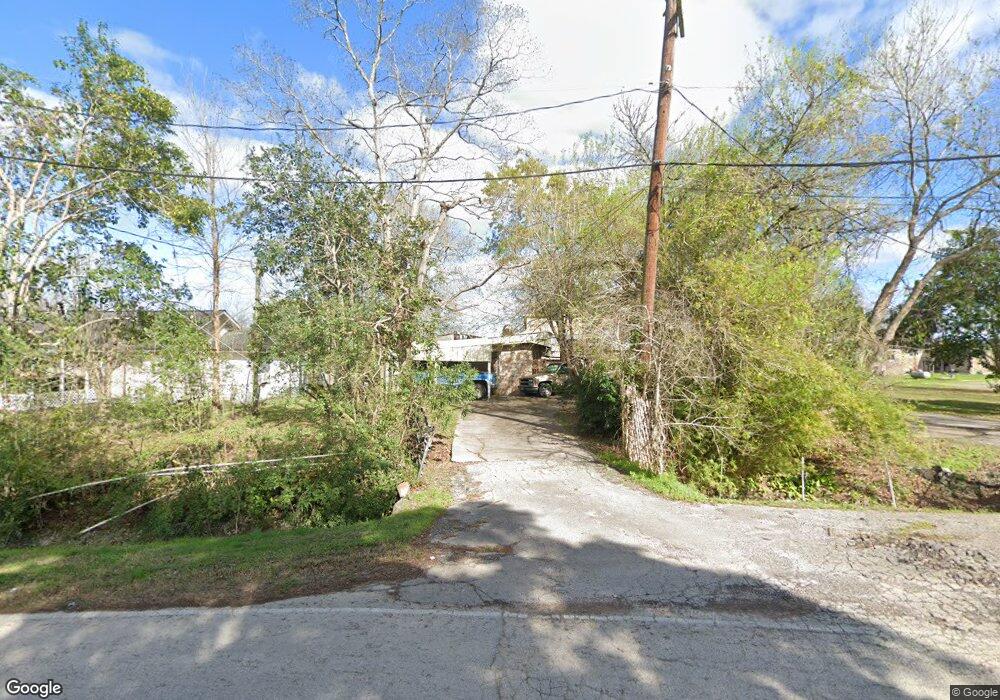
906 Forest River Dr Channelview, TX 77530
Estimated Value: $264,000 - $304,000
3
Beds
2
Baths
1,846
Sq Ft
$154/Sq Ft
Est. Value
About This Home
This home is located at 906 Forest River Dr, Channelview, TX 77530 and is currently estimated at $283,697, approximately $153 per square foot. 906 Forest River Dr is a home located in Harris County with nearby schools including Channelview High School and San Jacinto Christian Academy.
Ownership History
Date
Name
Owned For
Owner Type
Purchase Details
Closed on
May 11, 2015
Sold by
Sides James L
Bought by
Sides James L
Current Estimated Value
Home Financials for this Owner
Home Financials are based on the most recent Mortgage that was taken out on this home.
Original Mortgage
$65,000
Outstanding Balance
$50,182
Interest Rate
3.74%
Mortgage Type
New Conventional
Estimated Equity
$233,515
Purchase Details
Closed on
Oct 15, 1996
Sold by
Molina Gerardo Ramirez
Bought by
Sides Falva R
Purchase Details
Closed on
Mar 25, 1996
Sold by
Sides Falva R
Bought by
Sides Falva R and Falva Sides Family Living Trust
Purchase Details
Closed on
Aug 2, 1995
Sold by
Riddle Thomas A and Riddle Alice D
Bought by
Sides F R
Purchase Details
Closed on
Sep 15, 1985
Sold by
Sides Merideth and Sides Falva R
Bought by
Sides Falva R
Create a Home Valuation Report for This Property
The Home Valuation Report is an in-depth analysis detailing your home's value as well as a comparison with similar homes in the area
Home Values in the Area
Average Home Value in this Area
Purchase History
| Date | Buyer | Sale Price | Title Company |
|---|---|---|---|
| Sides James L | $65,000 | None Available | |
| Sides Falva R | -- | -- | |
| Sides Falva R | -- | None Available | |
| Sides F R | -- | -- | |
| Sides Falva R | -- | -- |
Source: Public Records
Mortgage History
| Date | Status | Borrower | Loan Amount |
|---|---|---|---|
| Open | Sides James L | $65,000 |
Source: Public Records
Tax History Compared to Growth
Tax History
| Year | Tax Paid | Tax Assessment Tax Assessment Total Assessment is a certain percentage of the fair market value that is determined by local assessors to be the total taxable value of land and additions on the property. | Land | Improvement |
|---|---|---|---|---|
| 2025 | $2,053 | $221,246 | $159,768 | $61,478 |
| 2024 | $2,053 | $221,246 | $159,768 | $61,478 |
| 2023 | $2,053 | $227,227 | $159,768 | $67,459 |
| 2022 | $2,529 | $123,538 | $71,895 | $51,643 |
| 2021 | $2,323 | $109,675 | $63,907 | $45,768 |
| 2020 | $2,214 | $100,573 | $57,516 | $43,057 |
| 2019 | $2,273 | $100,573 | $57,516 | $43,057 |
| 2018 | $1,404 | $100,573 | $57,516 | $43,057 |
| 2017 | $1,866 | $82,451 | $41,220 | $41,231 |
| 2016 | $1,701 | $75,161 | $41,220 | $33,941 |
| 2015 | $30 | $75,161 | $41,220 | $33,941 |
| 2014 | $30 | $75,161 | $41,220 | $33,941 |
Source: Public Records
Map
Nearby Homes
- 17119 Water Oak Dr
- 17102 River Rd
- 16811 Forest Trail Dr
- 00 Laurelwood Dr
- 16600 Laurelwood Dr
- 16736 Forest Trail Dr
- 17513 River Rd
- 17202 Meadowbrook Dr
- 16931 Avenue B
- 17325 River Rd
- 17427 Moreland Dr
- 0 Laurelwood Dr Unit 43034610
- 16725 Shady Ln
- 17512 River Rd
- 16326 Bear Bayou Dr
- 16219 Bear Bayou 1 2 Dr
- 17706 River Rd
- 16809 Market St
- 1211 Pecan St
- 16134 Palm St
- 910 Forest River Dr
- 902 Forest River Dr
- 911 Forest River Dr
- 1000 Forest River Dr
- 17138 Forest Trail Dr
- 17130 Water Oak Dr
- 1002 Forest River Dr
- 17142 Forest Trail Dr
- 17131 Forest Trail Dr
- 1006 Forest River Dr
- 1010 Forest River Dr
- 17126 Water Oak Dr
- 17123 Forest Trail Dr
- 17123 Forest Trail Dr
- 17122 Water Oak Dr
- 1015 Forest River Dr
- 1015 Forest River Dr
- 1014 Forest River Dr
- 1014 Forest River Dr
- 1016 Forest River Dr