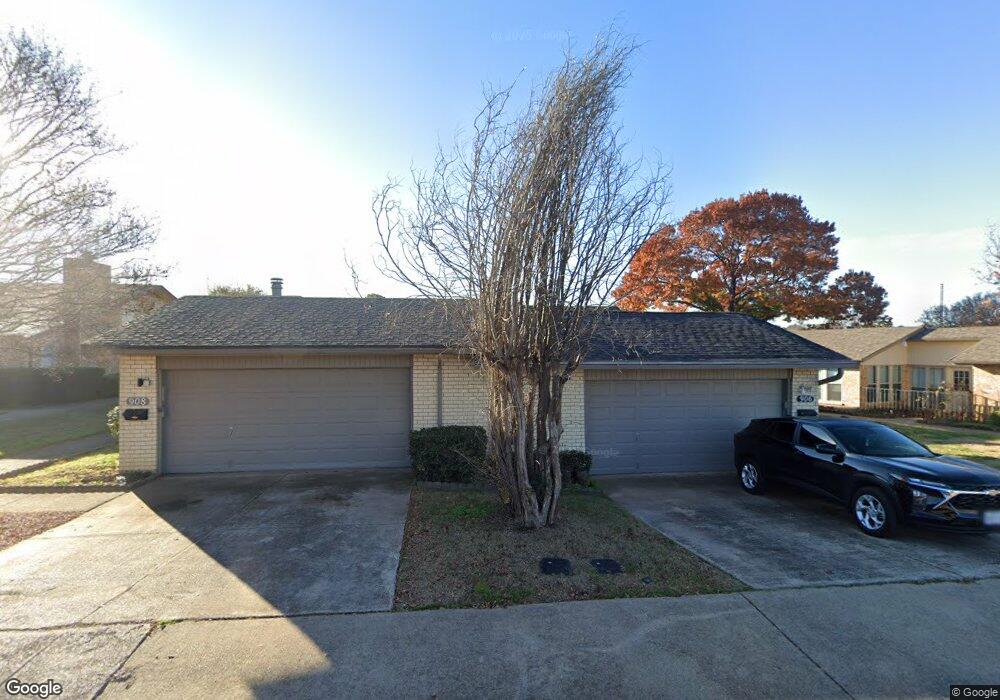
906 Harwood Rd Bedford, TX 76021
Estimated Value: $256,974 - $316,000
3
Beds
2
Baths
1,431
Sq Ft
$194/Sq Ft
Est. Value
About This Home
This home is located at 906 Harwood Rd, Bedford, TX 76021 and is currently estimated at $277,994, approximately $194 per square foot. 906 Harwood Rd is a home located in Tarrant County with nearby schools including Shady Brook Elementary School, Bedford Junior High School, and L.D. Bell High School.
Ownership History
Date
Name
Owned For
Owner Type
Purchase Details
Closed on
Oct 7, 2016
Sold by
Anderson Lisa M and Anderson Lewis S
Bought by
Anderson Lisa M and Anderson Lewis S
Current Estimated Value
Home Financials for this Owner
Home Financials are based on the most recent Mortgage that was taken out on this home.
Original Mortgage
$91,400
Outstanding Balance
$58,281
Interest Rate
3.46%
Mortgage Type
New Conventional
Estimated Equity
$219,713
Purchase Details
Closed on
Jan 30, 2004
Sold by
Cocke Eleanor R
Bought by
Arzu Lisa
Home Financials for this Owner
Home Financials are based on the most recent Mortgage that was taken out on this home.
Original Mortgage
$104,793
Interest Rate
5.78%
Mortgage Type
Purchase Money Mortgage
Purchase Details
Closed on
Jan 21, 2004
Sold by
Arzu Oswald
Bought by
Arzu Lisa M
Home Financials for this Owner
Home Financials are based on the most recent Mortgage that was taken out on this home.
Original Mortgage
$104,793
Interest Rate
5.78%
Mortgage Type
Purchase Money Mortgage
Create a Home Valuation Report for This Property
The Home Valuation Report is an in-depth analysis detailing your home's value as well as a comparison with similar homes in the area
Home Values in the Area
Average Home Value in this Area
Purchase History
| Date | Buyer | Sale Price | Title Company |
|---|---|---|---|
| Anderson Lisa M | -- | First American Title Ins Co | |
| Arzu Lisa | -- | -- | |
| Arzu Lisa M | -- | -- |
Source: Public Records
Mortgage History
| Date | Status | Borrower | Loan Amount |
|---|---|---|---|
| Open | Anderson Lisa M | $91,400 | |
| Previous Owner | Arzu Lisa | $104,793 |
Source: Public Records
Tax History Compared to Growth
Tax History
| Year | Tax Paid | Tax Assessment Tax Assessment Total Assessment is a certain percentage of the fair market value that is determined by local assessors to be the total taxable value of land and additions on the property. | Land | Improvement |
|---|---|---|---|---|
| 2025 | $3,721 | $271,360 | $65,000 | $206,360 |
| 2024 | $3,721 | $271,360 | $65,000 | $206,360 |
| 2023 | $4,416 | $248,743 | $40,000 | $208,743 |
| 2022 | $4,572 | $224,852 | $25,000 | $199,852 |
| 2021 | $4,482 | $191,818 | $25,000 | $166,818 |
| 2020 | $4,113 | $193,232 | $25,000 | $168,232 |
| 2019 | $3,820 | $173,934 | $25,000 | $148,934 |
| 2018 | $3,495 | $143,849 | $25,000 | $118,849 |
| 2017 | $3,144 | $129,968 | $25,000 | $104,968 |
| 2016 | $2,773 | $130,204 | $25,000 | $105,204 |
| 2015 | $2,342 | $104,200 | $15,000 | $89,200 |
| 2014 | $2,342 | $104,200 | $15,000 | $89,200 |
Source: Public Records
Map
Nearby Homes
- 801 Shady Creek Ln
- 922 Shady Creek Ln
- 3119 Spring Grove Dr
- 1013 Springdale Rd
- 2704 Shady Grove Dr
- 2700 Shady Grove Dr
- 3213 Spring Valley Dr
- 913 Kensington Ct
- 2501 Shady Grove Dr
- 817 Shady Lake Dr
- 2508 Lakeview Dr
- 2317 Shady Grove Dr
- 2436 Brookgreen Ct
- 2420 Stonegate Dr N
- 1401 Danielle Dr
- 1740 Brown Trail
- 2225 Shady Brook Dr
- 3605 Spring Valley Dr
- 432 Sunnybrook Ct
- 3609 Wayne Ct
- 904 Harwood Rd
- 908 Harwood Rd
- 903 Shady Creek Ln
- 803 Shady Creek Ln
- 909 Shady Creek Ln
- 805 Shady Creek Ln
- 911 Shady Creek Ln
- 901 Shady Creek Ln
- 917 Shady Creek Ln
- 915 Shady Creek Ln
- 914 Harwood Rd
- 916 Harwood Rd
- 808 Forest Glen Dr
- 919 Shady Creek Ln
- 812 Forest Glen Dr
- 918 Harwood Rd
- 804 Forest Glen Dr
- 910 Shady Creek Ln
- 912 Shady Creek Ln
- 816 Forest Glen Dr