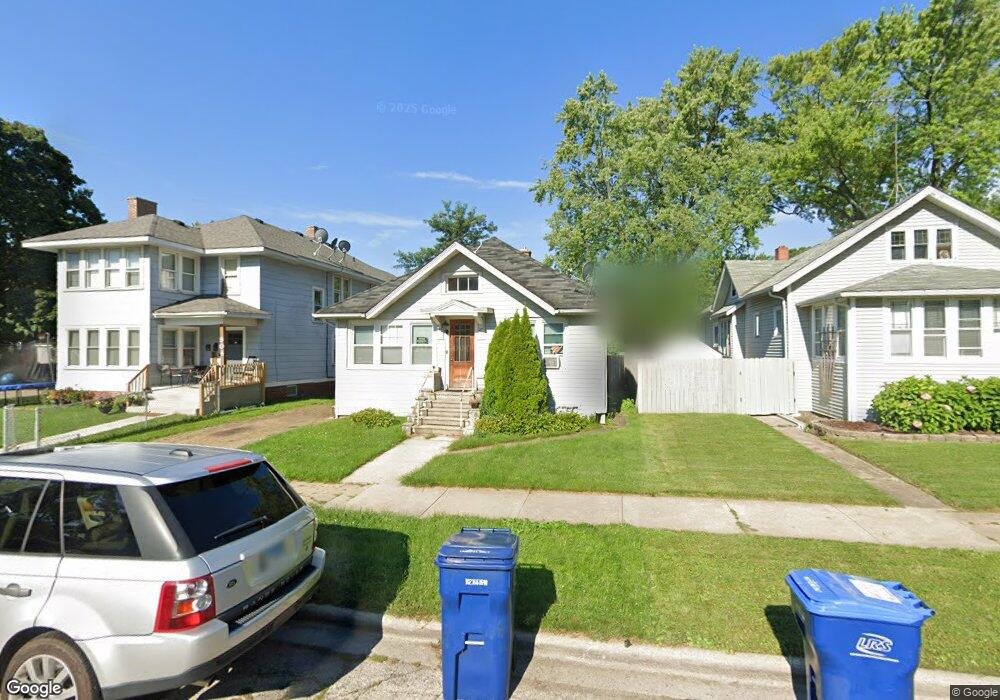
906 Hickory St Waukegan, IL 60085
Estimated Value: $167,000 - $202,000
2
Beds
1
Bath
1,120
Sq Ft
$168/Sq Ft
Est. Value
About This Home
This home is located at 906 Hickory St, Waukegan, IL 60085 and is currently estimated at $188,135, approximately $167 per square foot. 906 Hickory St is a home located in Lake County with nearby schools including Glen Flora Elementary School, Edith M Smith Middle School, and Waukegan High School.
Ownership History
Date
Name
Owned For
Owner Type
Purchase Details
Closed on
Feb 23, 2004
Sold by
Wm Specialty Mortgage Llc
Bought by
Delgado Pedro M and Delgado Martha P
Current Estimated Value
Home Financials for this Owner
Home Financials are based on the most recent Mortgage that was taken out on this home.
Original Mortgage
$74,600
Outstanding Balance
$34,695
Interest Rate
5.71%
Mortgage Type
Purchase Money Mortgage
Estimated Equity
$153,440
Purchase Details
Closed on
Dec 9, 2003
Sold by
Perez
Bought by
Wm Specialty Mortgage Llc
Purchase Details
Closed on
Mar 2, 1994
Sold by
Spillane Patrick J and Spillane Patricia A
Bought by
Perez Jesse and Perez Betty J
Home Financials for this Owner
Home Financials are based on the most recent Mortgage that was taken out on this home.
Original Mortgage
$73,181
Interest Rate
7.1%
Mortgage Type
FHA
Create a Home Valuation Report for This Property
The Home Valuation Report is an in-depth analysis detailing your home's value as well as a comparison with similar homes in the area
Home Values in the Area
Average Home Value in this Area
Purchase History
| Date | Buyer | Sale Price | Title Company |
|---|---|---|---|
| Delgado Pedro M | $99,500 | Wheatland Title | |
| Wm Specialty Mortgage Llc | -- | -- | |
| Perez Jesse | $48,666 | Chicago Title Insurance Co |
Source: Public Records
Mortgage History
| Date | Status | Borrower | Loan Amount |
|---|---|---|---|
| Open | Delgado Pedro M | $74,600 | |
| Previous Owner | Perez Jesse | $73,181 |
Source: Public Records
Tax History Compared to Growth
Tax History
| Year | Tax Paid | Tax Assessment Tax Assessment Total Assessment is a certain percentage of the fair market value that is determined by local assessors to be the total taxable value of land and additions on the property. | Land | Improvement |
|---|---|---|---|---|
| 2024 | $4,055 | $48,038 | $7,168 | $40,870 |
| 2023 | $3,874 | $43,008 | $6,417 | $36,591 |
| 2022 | $3,874 | $39,627 | $6,103 | $33,524 |
| 2021 | $3,566 | $34,200 | $5,444 | $28,756 |
| 2020 | $3,612 | $31,862 | $5,072 | $26,790 |
| 2019 | $3,635 | $29,197 | $4,648 | $24,549 |
| 2018 | $3,652 | $28,248 | $5,919 | $22,329 |
| 2017 | $3,555 | $24,992 | $5,237 | $19,755 |
| 2016 | $3,356 | $21,717 | $4,551 | $17,166 |
| 2015 | $3,283 | $19,437 | $4,073 | $15,364 |
| 2014 | $3,250 | $19,213 | $4,499 | $14,714 |
| 2012 | $4,029 | $20,815 | $4,874 | $15,941 |
Source: Public Records
Map
Nearby Homes
- 918 N Ash St
- 415 W Ridgeland Ave
- 1110 N Ash St
- 620 N Poplar St
- 702 Franklin St
- 325 4th St
- 522 N Poplar St
- 917 N Linden Ave
- 723 N County St
- 1109 Massena Ave
- 511 Chestnut St
- 428 N Poplar St
- 452 North Ave
- 1336 N Ash St
- 1335 Chestnut St
- 1105 Woodlawn Cir
- 1000 Pine St
- 611 N Genesee St
- 1312 N Linden Ave
- 426 Julian St
- 910 Hickory St
- 904 Hickory St
- 914 Hickory St
- 616 Massena Ave
- 846 Hickory St
- 522 Massena Ave
- 918 Hickory St
- 620 Massena Ave
- 913 N Ash St
- 844 Hickory St
- 520 Massena Ave
- 922 Hickory St
- 611 Massena Ave
- 622 Massena Ave
- 917 N Ash St
- 845 Hickory St
- 845 N Ash St
- 915 Hickory St
- 840 Hickory St
- 514 Massena Ave