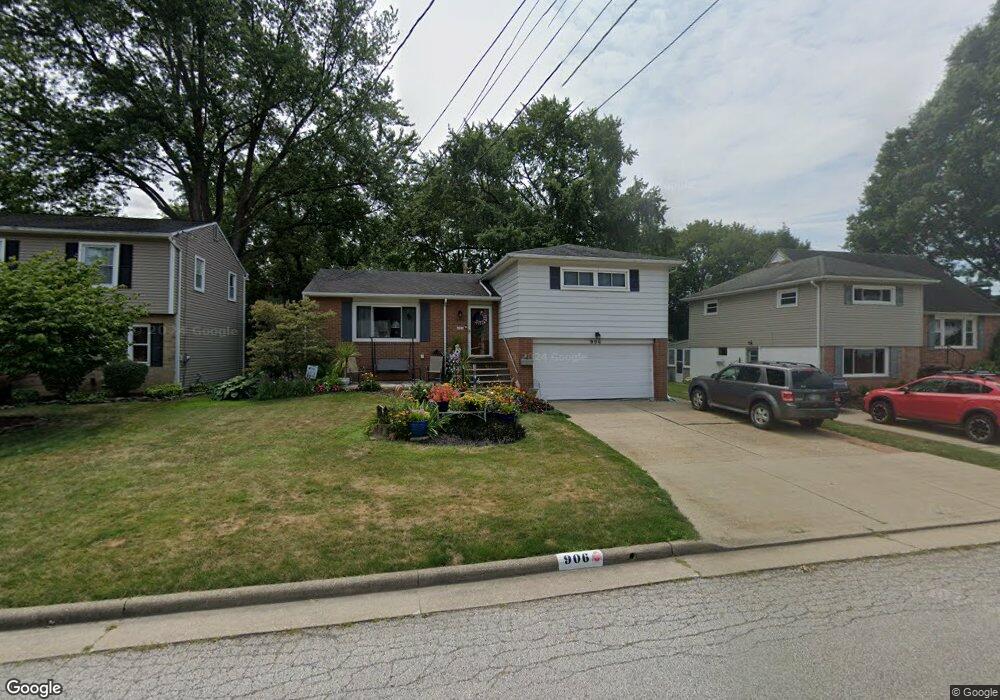
906 Lynbrook St SE North Canton, OH 44720
Mount Vernon NeighborhoodEstimated Value: $221,000 - $254,000
3
Beds
2
Baths
1,412
Sq Ft
$170/Sq Ft
Est. Value
About This Home
This home is located at 906 Lynbrook St SE, North Canton, OH 44720 and is currently estimated at $239,536, approximately $169 per square foot. 906 Lynbrook St SE is a home located in Stark County with nearby schools including North Canton Middle School, Hoover High School, and St Paul School.
Ownership History
Date
Name
Owned For
Owner Type
Purchase Details
Closed on
Feb 27, 2023
Sold by
Humphreys John T and Humphreys Tonya J
Bought by
Humphreys John T and Humphreys Tonya J
Current Estimated Value
Purchase Details
Closed on
Sep 13, 1994
Sold by
Burnosky Frank J
Bought by
Humphreys John T and Humphreys Tonya
Home Financials for this Owner
Home Financials are based on the most recent Mortgage that was taken out on this home.
Original Mortgage
$63,000
Interest Rate
8.65%
Mortgage Type
New Conventional
Create a Home Valuation Report for This Property
The Home Valuation Report is an in-depth analysis detailing your home's value as well as a comparison with similar homes in the area
Home Values in the Area
Average Home Value in this Area
Purchase History
| Date | Buyer | Sale Price | Title Company |
|---|---|---|---|
| Humphreys John T | -- | None Listed On Document | |
| Humphreys John T | -- | -- | |
| Humphreys John T | $88,000 | -- |
Source: Public Records
Mortgage History
| Date | Status | Borrower | Loan Amount |
|---|---|---|---|
| Previous Owner | Humphreys John T | $63,000 |
Source: Public Records
Tax History Compared to Growth
Tax History
| Year | Tax Paid | Tax Assessment Tax Assessment Total Assessment is a certain percentage of the fair market value that is determined by local assessors to be the total taxable value of land and additions on the property. | Land | Improvement |
|---|---|---|---|---|
| 2025 | -- | $77,770 | $11,620 | $66,150 |
| 2024 | -- | $77,770 | $11,620 | $66,150 |
| 2023 | $2,253 | $51,280 | $8,610 | $42,670 |
| 2022 | $2,188 | $51,280 | $8,610 | $42,670 |
| 2021 | $2,110 | $51,280 | $8,610 | $42,670 |
| 2020 | $1,967 | $44,350 | $7,490 | $36,860 |
| 2019 | $2,286 | $44,350 | $7,490 | $36,860 |
| 2018 | $2,370 | $44,350 | $7,490 | $36,860 |
| 2017 | $2,093 | $41,130 | $6,690 | $34,440 |
| 2016 | $2,101 | $41,130 | $6,690 | $34,440 |
| 2015 | $2,050 | $39,980 | $6,690 | $33,290 |
| 2014 | $42 | $37,170 | $6,230 | $30,940 |
| 2013 | $1,025 | $37,170 | $6,230 | $30,940 |
Source: Public Records
Map
Nearby Homes
- 1321 Clinton Ave SE
- 1126 Overridge Ave SE
- 1118 Overridge Ave SE
- 505 Rose Lane St SE
- 1381 Circle Hill Rd SE
- 322 Schneider St SE
- 634 Edgewood St SE
- 701 Edgewood St SE
- 714 Pershing Ave SE
- 1402 Schneider St NW
- 139 Maplecrest St SW
- 161 Hallum St SW
- 1415 Red Coach St SE
- 218 Bonnett St SW
- 723 Jennifer Dr NW
- 1603 S Main St Unit B
- 253 Glenwood St SW
- 1653 Greenway Rd SE Unit 202
- 1224 Grassmere St SE
- 1690 Carlton Ave SE
- 912 Lynbrook St SE
- 900 Lynbrook St SE
- 907 Oakwood St SE
- 918 Lynbrook St SE
- 901 Oakwood St SE
- 913 Oakwood St SE
- 820 Lynbrook St SE
- 919 Oakwood St SE
- 911 Lynbrook St SE
- 905 Lynbrook St SE
- 924 Lynbrook St SE
- 917 Lynbrook St SE
- 925 Oakwood St SE
- 815 Lynbrook St SE
- 930 Lynbrook St SE
- 923 Lynbrook St SE
- 1303 Overridge Ave SE
- 931 Oakwood St SE
- 929 Lynbrook St SE
- 1318 Clinton Ave SE