Estimated Value: $170,012 - $273,000
--
Bed
1
Bath
2,018
Sq Ft
$108/Sq Ft
Est. Value
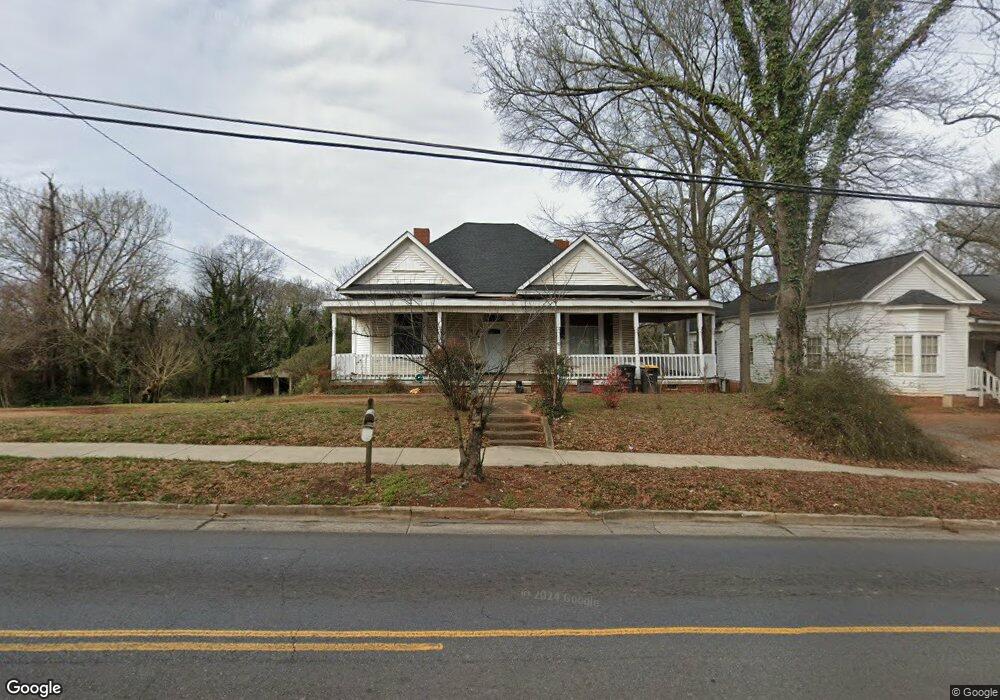
About This Home
This home is located at 906 Maple Ave SW, Rome, GA 30161 and is currently estimated at $218,253, approximately $108 per square foot. 906 Maple Ave SW is a home located in Floyd County with nearby schools including Rome High School, St. Mary School, and Darlington School.
Ownership History
Date
Name
Owned For
Owner Type
Purchase Details
Closed on
Aug 11, 2022
Sold by
Gordinez Marta
Bought by
Godinez Delmy Melendez
Current Estimated Value
Purchase Details
Closed on
Mar 7, 2011
Sold by
Chandler David S and Chandler Linda A
Bought by
Gordinez Marta
Purchase Details
Closed on
Oct 30, 2002
Sold by
Allen Robert J
Bought by
Chandler David S and Chandler Linda A
Purchase Details
Closed on
Dec 29, 1999
Sold by
Allen Robert Jerry
Bought by
Allen Robert J
Purchase Details
Closed on
Aug 25, 1999
Bought by
P and R
Purchase Details
Closed on
May 31, 1985
Sold by
Jones Theodore R and Jones Delle D
Bought by
Allen Robert Jerry
Purchase Details
Closed on
May 30, 1985
Bought by
P and R
Purchase Details
Closed on
Jan 31, 1985
Sold by
Grizzaffi Clydie Mae
Bought by
Jones Theodore R and Jones Delle D
Purchase Details
Closed on
May 11, 1983
Sold by
Chastain Theo
Bought by
Grizzaffi Clydie Mae
Purchase Details
Closed on
May 10, 1983
Bought by
P and R
Purchase Details
Closed on
Jan 1, 1901
Bought by
Chastain Theo
Create a Home Valuation Report for This Property
The Home Valuation Report is an in-depth analysis detailing your home's value as well as a comparison with similar homes in the area
Home Values in the Area
Average Home Value in this Area
Purchase History
| Date | Buyer | Sale Price | Title Company |
|---|---|---|---|
| Godinez Delmy Melendez | -- | -- | |
| Gordinez Marta | $37,100 | -- | |
| Chandler David S | $38,300 | -- | |
| Allen Robert J | -- | -- | |
| P | -- | -- | |
| Allen Robert Jerry | -- | -- | |
| P | -- | -- | |
| P | -- | -- | |
| Jones Theodore R | $22,000 | -- | |
| Grizzaffi Clydie Mae | $22,500 | -- | |
| P | -- | -- | |
| Chastain Theo | -- | -- |
Source: Public Records
Tax History
| Year | Tax Paid | Tax Assessment Tax Assessment Total Assessment is a certain percentage of the fair market value that is determined by local assessors to be the total taxable value of land and additions on the property. | Land | Improvement |
|---|---|---|---|---|
| 2025 | $2,479 | $69,338 | $7,000 | $62,338 |
| 2024 | $2,479 | $63,800 | $6,364 | $57,436 |
| 2023 | $2,259 | $54,084 | $5,786 | $48,298 |
| 2022 | $1,617 | $44,314 | $4,628 | $39,686 |
| 2021 | $1,443 | $38,898 | $4,628 | $34,270 |
| 2020 | $1,338 | $35,758 | $3,616 | $32,142 |
| 2019 | $1,245 | $33,628 | $3,616 | $30,012 |
| 2018 | $1,166 | $31,500 | $3,616 | $27,884 |
| 2017 | $1,118 | $30,204 | $3,616 | $26,588 |
| 2016 | $1,088 | $29,292 | $3,600 | $25,692 |
| 2015 | $1,027 | $29,292 | $3,600 | $25,692 |
| 2014 | $1,027 | $29,292 | $3,600 | $25,692 |
Source: Public Records
Map
Nearby Homes
- 1 E 11th St SW
- 803/805 Maple Ave SW
- 803/80 Maple Ave SW
- 166 E 11th St SW
- 162 E 11th St SE
- 168 E 11th St SE
- 164 E 11th St SE
- 170 E 11th St SW
- 801 Maple Ave SW
- 9 Eastridge Ct SW
- 1011 Walnut Ave SW
- 31 Notasulga Dr SW
- 2 Coral Ave SW
- 209 Moultrie Ln SE
- 419 E 13th St SW
- 415 E 10th St SE
- 416 E 9th St SE
- 525 E 14th St SW
- 39 E 16th St SW
- 200 Cave Spring St SW
- 906 Maple Ave SW
- 904 Maple Ave SW
- 14 E 9th St SW Unit &1
- 14 E 9th St SW
- 16 E 9th St SW
- 903 Maple Ave SW
- 12 E 9th St SW
- 901 Maple Ave SW
- 907 Maple Ave SW Unit 2
- 907 Maple Ave SW Unit 5
- 907 Maple Ave SW Unit 4
- 907 Maple Ave SW Unit 3
- 907 Maple Ave SW Unit 1
- 907 Maple Ave SW
- 909 Maple Ave SW
- 913 Maple Ave SW Unit A & B
- 913 Maple Ave SW
- 100 E 9th St SE
- 100 E 9th St SE Unit A
- 102 E 9th St SW
Your Personal Tour Guide
Ask me questions while you tour the home.