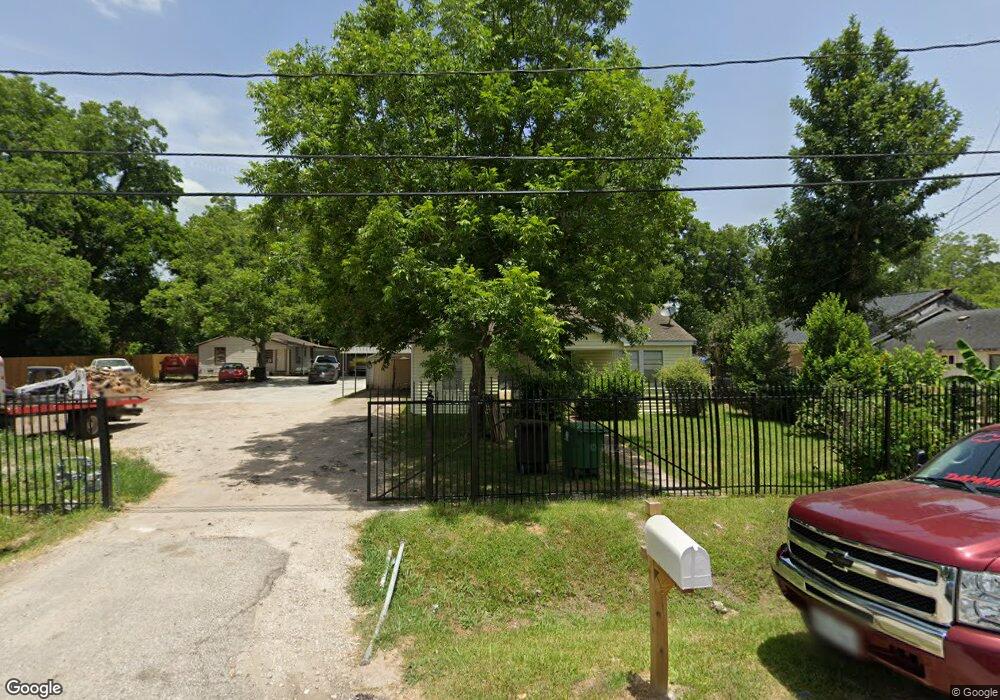
906 Prosper St Houston, TX 77088
Acres Homes NeighborhoodEstimated Value: $129,000 - $162,000
3
Beds
1
Bath
1,268
Sq Ft
$112/Sq Ft
Est. Value
About This Home
This home is located at 906 Prosper St, Houston, TX 77088 and is currently estimated at $142,523, approximately $112 per square foot. 906 Prosper St is a home located in Harris County with nearby schools including Osborne Elementary School, Williams Middle, and Booker T Washington Sr High.
Ownership History
Date
Name
Owned For
Owner Type
Purchase Details
Closed on
Jan 29, 2015
Sold by
Bell Larry J
Bought by
Bell Larry J and Bell Lula
Current Estimated Value
Home Financials for this Owner
Home Financials are based on the most recent Mortgage that was taken out on this home.
Original Mortgage
$60,000
Interest Rate
3.82%
Mortgage Type
New Conventional
Purchase Details
Closed on
Aug 19, 2008
Sold by
Bell Larry J and Estate Of Nelson Bell
Bought by
Bell Larry J
Create a Home Valuation Report for This Property
The Home Valuation Report is an in-depth analysis detailing your home's value as well as a comparison with similar homes in the area
Home Values in the Area
Average Home Value in this Area
Purchase History
| Date | Buyer | Sale Price | Title Company |
|---|---|---|---|
| Bell Larry J | -- | None Available | |
| Bell Larry J | -- | None Available |
Source: Public Records
Mortgage History
| Date | Status | Borrower | Loan Amount |
|---|---|---|---|
| Closed | Bell Larry J | $60,000 |
Source: Public Records
Tax History
| Year | Tax Paid | Tax Assessment Tax Assessment Total Assessment is a certain percentage of the fair market value that is determined by local assessors to be the total taxable value of land and additions on the property. | Land | Improvement |
|---|---|---|---|---|
| 2025 | $2,693 | $131,862 | $91,020 | $40,842 |
| 2024 | $2,693 | $128,688 | $91,020 | $37,668 |
| 2023 | $2,693 | $129,548 | $91,020 | $38,528 |
| 2022 | $2,527 | $114,765 | $71,040 | $43,725 |
| 2021 | $2,060 | $88,392 | $46,620 | $41,772 |
| 2020 | $1,965 | $81,140 | $39,960 | $41,180 |
| 2019 | $1,941 | $76,700 | $35,520 | $41,180 |
| 2018 | $1,607 | $63,509 | $23,760 | $39,749 |
| 2017 | $1,332 | $52,682 | $15,840 | $36,842 |
| 2016 | $1,332 | $52,682 | $15,840 | $36,842 |
| 2015 | $1,280 | $49,809 | $15,840 | $33,969 |
| 2014 | $1,280 | $49,809 | $15,840 | $33,969 |
Source: Public Records
Map
Nearby Homes
- 911 Fortune St
- 884 Prosper St
- 882 Prosper St
- 955 Ringold St
- 906 Fortune St
- 957 Ringold St
- 882 Fortune St
- 978 Saint Clair St
- 851 Prosper St
- 887 Lucky St
- 851 S Victory Dr Unit B C
- 0 Fortune St
- 954 Junell St Unit A
- 1035 Junell St
- 956 Junell Unit A
- 839 Fortune St
- 7513 Knox St
- 0 St Clair Unit 40573378
- 955 Lucky St
- 813 Fortune St
Your Personal Tour Guide
Ask me questions while you tour the home.