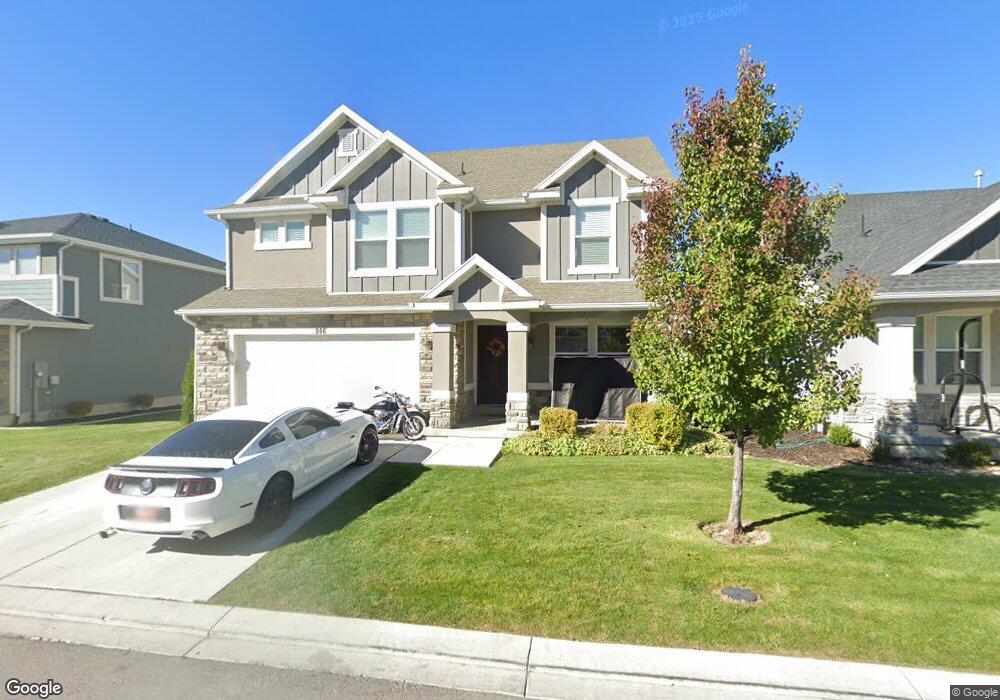
906 S 2100 W Orem, UT 84059
Sunset Heights NeighborhoodEstimated Value: $700,636 - $747,000
4
Beds
4
Baths
3,459
Sq Ft
$209/Sq Ft
Est. Value
About This Home
This home is located at 906 S 2100 W, Orem, UT 84059 and is currently estimated at $723,879, approximately $209 per square foot. 906 S 2100 W is a home located in Utah County with nearby schools including Vineyard Elementary School, Lakeridge Jr High School, and Mountain View High School.
Ownership History
Date
Name
Owned For
Owner Type
Purchase Details
Closed on
Sep 8, 2022
Sold by
D & W Estates Llc
Bought by
Tapia Heber Uziel
Current Estimated Value
Home Financials for this Owner
Home Financials are based on the most recent Mortgage that was taken out on this home.
Original Mortgage
$607,050
Outstanding Balance
$579,825
Interest Rate
5.22%
Mortgage Type
Balloon
Estimated Equity
$144,054
Purchase Details
Closed on
Jan 17, 2018
Sold by
D & W Sorensen Family Trust
Bought by
D & W Estates Llc
Purchase Details
Closed on
Apr 5, 2016
Sold by
Sorensen Daniel
Bought by
Sorensen Daniel and Sorensen Whitney
Purchase Details
Closed on
Jan 11, 2016
Sold by
Edge Land 14 Llc
Bought by
Sorensen Daniel
Home Financials for this Owner
Home Financials are based on the most recent Mortgage that was taken out on this home.
Original Mortgage
$249,579
Interest Rate
3.9%
Mortgage Type
New Conventional
Create a Home Valuation Report for This Property
The Home Valuation Report is an in-depth analysis detailing your home's value as well as a comparison with similar homes in the area
Home Values in the Area
Average Home Value in this Area
Purchase History
| Date | Buyer | Sale Price | Title Company |
|---|---|---|---|
| Tapia Heber Uziel | -- | Metro National Title | |
| D & W Estates Llc | -- | South Land Title | |
| Sorensen Daniel | -- | Provo Land Title Co | |
| Sorensen Daniel | -- | Provo Land Title Co |
Source: Public Records
Mortgage History
| Date | Status | Borrower | Loan Amount |
|---|---|---|---|
| Open | Tapia Heber Uziel | $607,050 | |
| Previous Owner | Sorensen Daniel | $249,579 |
Source: Public Records
Tax History
| Year | Tax Paid | Tax Assessment Tax Assessment Total Assessment is a certain percentage of the fair market value that is determined by local assessors to be the total taxable value of land and additions on the property. | Land | Improvement |
|---|---|---|---|---|
| 2025 | $4,829 | $645,000 | $208,000 | $437,000 |
| 2024 | $4,829 | $590,500 | $0 | $0 |
| 2023 | $4,546 | $597,500 | $0 | $0 |
| 2022 | $4,922 | $626,700 | $211,200 | $415,500 |
| 2021 | $4,258 | $451,600 | $132,000 | $319,600 |
| 2020 | $2,239 | $424,400 | $120,000 | $304,400 |
| 2019 | $2,035 | $401,100 | $115,000 | $286,100 |
| 2018 | $1,932 | $363,800 | $115,000 | $248,800 |
| 2017 | $1,636 | $165,000 | $0 | $0 |
| 2016 | $1,669 | $155,265 | $0 | $0 |
| 2015 | $853 | $75,000 | $0 | $0 |
Source: Public Records
Map
Nearby Homes
- 894 S 2100 W
- 943 S 2150 W
- 1963 W Golden Pond Way
- 1813 W 795 S Unit 231
- 713 S 1803 W
- 1863 W 645 S
- 167 E Lake View Dr
- 937 S 1635 W
- 1618 W 860 S
- 674 S Lake View Dr Unit 337
- 2 W Stillwater St Unit 144
- 3 W Stillwater St Unit 161
- 12 W Stillwater St Unit 148
- 583 E Parker Place
- 481 S Main St Unit Lot 139
- 16 W Stillwater St Unit 150
- 441 S Main St Unit 135
- 344 S Tahoe St
- 338 S Holdaway Rd
- 1463 W 730 S
- 906 S 2100 W Unit 422
- 900 S 2100 W Unit 423
- 900 S 2100 W
- 916 S 2100 W Unit 421
- 921 S 2150 W Unit 327
- 921 S 2150 W Unit 328
- 921 S 2150 W
- 911 S 2150 W
- 911 S 2150 W Unit 329
- 894 S 2100 W Unit 424
- 932 S 2100 W Unit 420
- 925 S 2150 W Unit 327
- 925 S 2150 W Unit 328
- 905 S 2100 W Unit 404
- 909 S 2100 W Unit 405
- 909 S 2100 W
- 901 S 2100 W Unit 403
- 901 S 2100 W
- 919 S 2100 W Unit 406
- 919 S 2100 W
Your Personal Tour Guide
Ask me questions while you tour the home.