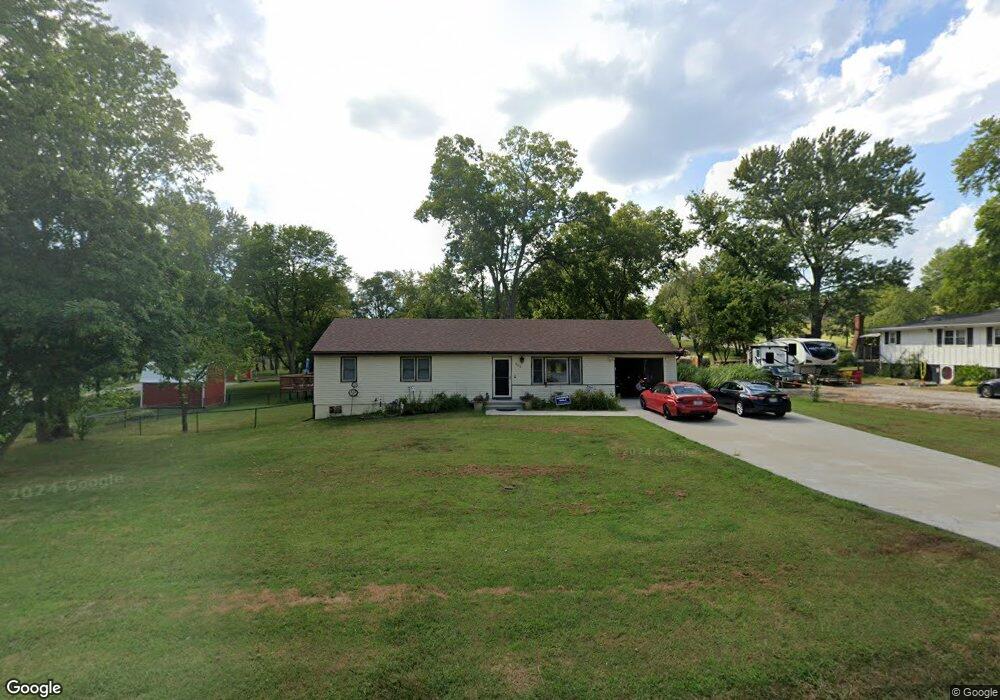
906 S Main Rd Independence, MO 64056
Spring Branch NeighborhoodEstimated Value: $124,000 - $240,000
2
Beds
1
Bath
1,336
Sq Ft
$138/Sq Ft
Est. Value
About This Home
This home is located at 906 S Main Rd, Independence, MO 64056 and is currently estimated at $184,303, approximately $137 per square foot. 906 S Main Rd is a home located in Jackson County with nearby schools including Spring Branch Elementary School, Bridger Middle School, and Bingham Middle School.
Ownership History
Date
Name
Owned For
Owner Type
Purchase Details
Closed on
Jan 6, 2014
Sold by
Barrier Linda M
Bought by
Barrier Linda M and Barrier Gail M
Current Estimated Value
Purchase Details
Closed on
Aug 22, 2011
Sold by
Barrier Betty M and Barrier Ottis Edward
Bought by
Barrier Linda M
Home Financials for this Owner
Home Financials are based on the most recent Mortgage that was taken out on this home.
Original Mortgage
$60,000
Outstanding Balance
$41,485
Interest Rate
4.54%
Mortgage Type
Credit Line Revolving
Estimated Equity
$142,818
Purchase Details
Closed on
Jun 16, 2011
Sold by
Barrier Betty M
Bought by
Barrier Linda M
Purchase Details
Closed on
Mar 7, 2003
Sold by
Barnes Charlotte L
Bought by
Barrier Betty M
Purchase Details
Closed on
Jan 8, 1998
Sold by
Barrier Betty and Barrier Ottis Edward
Bought by
Barnes Charlotte L
Purchase Details
Closed on
Sep 12, 1997
Sold by
Barnes Charlotte L
Bought by
Barrier Betty Marie
Create a Home Valuation Report for This Property
The Home Valuation Report is an in-depth analysis detailing your home's value as well as a comparison with similar homes in the area
Home Values in the Area
Average Home Value in this Area
Purchase History
| Date | Buyer | Sale Price | Title Company |
|---|---|---|---|
| Barrier Linda M | -- | None Available | |
| Barrier Linda M | -- | Accommodation | |
| Barrier Linda M | -- | None Available | |
| Barrier Betty M | -- | -- | |
| Barnes Charlotte L | -- | -- | |
| Barrier Betty Marie | -- | -- |
Source: Public Records
Mortgage History
| Date | Status | Borrower | Loan Amount |
|---|---|---|---|
| Open | Barrier Linda M | $60,000 |
Source: Public Records
Tax History
| Year | Tax Paid | Tax Assessment Tax Assessment Total Assessment is a certain percentage of the fair market value that is determined by local assessors to be the total taxable value of land and additions on the property. | Land | Improvement |
|---|---|---|---|---|
| 2025 | $1,918 | $29,148 | $7,649 | $21,499 |
| 2024 | $1,874 | $27,683 | $4,364 | $23,319 |
| 2023 | $1,874 | $27,683 | $3,667 | $24,016 |
| 2022 | $1,628 | $22,040 | $4,807 | $17,233 |
| 2021 | $1,627 | $22,040 | $4,807 | $17,233 |
| 2020 | $1,518 | $19,977 | $4,807 | $15,170 |
| 2019 | $1,494 | $19,977 | $4,807 | $15,170 |
| 2018 | $1,561 | $19,927 | $4,080 | $15,847 |
| 2017 | $1,561 | $19,927 | $4,080 | $15,847 |
| 2016 | $1,537 | $19,427 | $4,305 | $15,122 |
Source: Public Records
Map
Nearby Homes
- 18710 E Truman Rd
- 728 S Kisner Dr
- 933 S Kisner Dr
- 907 S Jones Rd
- 1804 S Sioux Ct
- 1904 S Davis Ave
- 20118 E Truman Rd
- 1215 Berry Rd
- 20021 E 13th St S
- 701 S Jones Rd
- 1225 Berry Rd
- 20108 E 12th Terrace S
- 801 S Butler Ln
- 20602 E Truman Rd N
- 915 N Cochise Dr
- 18505 E 5th St N
- 1704 Highland Dr
- 18607 E 6th St N
- 20802 E 13th Terrace S
- 1309 S Mchenry St
- 900 S Main Rd
- 912 S Main Rd
- 905 S Main Rd
- 911 S Main Rd
- 907 S Main Rd
- 18811 E 9th St S
- 901 S Main Rd
- 1000 S Main Rd
- 18812 E 9th St S
- 18906 E 9th St S
- 1004 S Main Rd
- 1001 S Main Rd
- 18808 E 9th St S
- 906 S Ann St
- 19007 E 9th St S
- 814 S Main Rd
- 1010 S Main Rd
- 815 S Main Rd
- 19000 E 9th St S
- 1009 S Main Rd
Your Personal Tour Guide
Ask me questions while you tour the home.