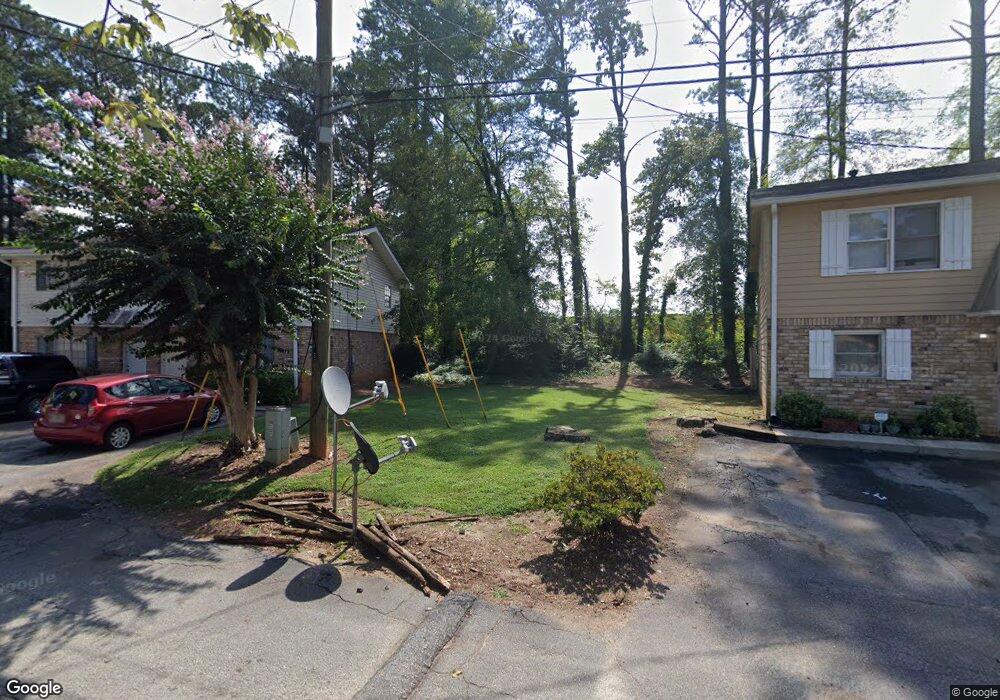
906 Six Oaks Cir Unit B Norcross, GA 30093
Estimated Value: $182,000 - $198,000
2
Beds
2
Baths
1,224
Sq Ft
$157/Sq Ft
Est. Value
About This Home
This home is located at 906 Six Oaks Cir Unit B, Norcross, GA 30093 and is currently estimated at $192,095, approximately $156 per square foot. 906 Six Oaks Cir Unit B is a home located in Gwinnett County with nearby schools including Lilburn Elementary School, Lilburn Middle School, and Meadowcreek High School.
Ownership History
Date
Name
Owned For
Owner Type
Purchase Details
Closed on
Mar 30, 2021
Sold by
Chaudhry Haroon Rafiq
Bought by
Motiwalla Farmeen Rashad
Current Estimated Value
Purchase Details
Closed on
Jul 27, 2016
Sold by
Rashad Farmeen
Bought by
Chaudhry Haroon Rafique
Purchase Details
Closed on
Oct 21, 2013
Sold by
Motiwalla Jabeen Rashad
Bought by
Motiwalla Farmeen Rashad
Purchase Details
Closed on
Feb 6, 2013
Sold by
Chaudhry Haroon R
Bought by
Motiwalla Jabeen Rashad
Purchase Details
Closed on
Dec 15, 2010
Sold by
Midfirst Bk
Bought by
Chaudhry Haroon R
Purchase Details
Closed on
Nov 3, 2009
Sold by
Forman Monique Y
Bought by
Midfirst Bk
Purchase Details
Closed on
Apr 19, 2002
Sold by
Morford Edmond D
Bought by
Hung Hsiu Lan
Home Financials for this Owner
Home Financials are based on the most recent Mortgage that was taken out on this home.
Original Mortgage
$60,800
Interest Rate
7.16%
Mortgage Type
New Conventional
Create a Home Valuation Report for This Property
The Home Valuation Report is an in-depth analysis detailing your home's value as well as a comparison with similar homes in the area
Home Values in the Area
Average Home Value in this Area
Purchase History
| Date | Buyer | Sale Price | Title Company |
|---|---|---|---|
| Motiwalla Farmeen Rashad | -- | -- | |
| Chaudhry Haroon Rafique | -- | -- | |
| Motiwalla Farmeen Rashad | $16,500 | -- | |
| Motiwalla Jabeen Rashad | -- | -- | |
| Chaudhry Haroon R | $15,000 | -- | |
| Midfirst Bk | $68,775 | -- | |
| Hung Hsiu Lan | $76,000 | -- | |
| Morford Edmond D | -- | -- |
Source: Public Records
Mortgage History
| Date | Status | Borrower | Loan Amount |
|---|---|---|---|
| Previous Owner | Morford Edmond D | $60,800 |
Source: Public Records
Tax History Compared to Growth
Tax History
| Year | Tax Paid | Tax Assessment Tax Assessment Total Assessment is a certain percentage of the fair market value that is determined by local assessors to be the total taxable value of land and additions on the property. | Land | Improvement |
|---|---|---|---|---|
| 2025 | -- | $76,960 | $14,000 | $62,960 |
| 2024 | $1,932 | $72,720 | $14,000 | $58,720 |
| 2023 | $1,932 | $53,040 | $7,200 | $45,840 |
| 2022 | $1,533 | $53,040 | $7,200 | $45,840 |
| 2021 | $1,553 | $41,920 | $4,000 | $37,920 |
| 2020 | $1,334 | $35,600 | $4,000 | $31,600 |
| 2019 | $1,109 | $30,560 | $4,000 | $26,560 |
| 2018 | $764 | $20,600 | $4,000 | $16,600 |
| 2016 | $622 | $16,560 | $4,000 | $12,560 |
| 2015 | $629 | $16,560 | $4,000 | $12,560 |
| 2014 | -- | $14,076 | $3,400 | $10,676 |
Source: Public Records
Map
Nearby Homes
- 936 Six Oaks Cir Unit B
- 897 Six Oaks Cir Unit B
- 5605 Rock Place Ct
- 5665 Terremont Cir
- 1258 Roman Point Dr
- 1437 Roman Point Dr
- 1013 Sandune Dr
- 5554 Clover Rise Ln Unit 2
- 1353 Harbins Ridge Dr Unit 36
- 5719 Singlebriar Ct
- 5431 Village Green Square Unit 1018
- 5425 Village Green Square Unit 3
- 1413 Silver Lake Dr
- 1133 Sandune Dr
- 1461 Silver Lake Dr
- 5590 Stonewood Ct
- 1637 Roman Point Dr
- 5333 Bishops Cir
- 5775 Dekalb Ln
- 5341 Woodbin Dr
- 906 Six Oaks Cir Unit A
- 906 Six Oaks Cir
- 906 Six Oaks Cir
- 906 Six Oaks Cir Unit A
- 926 6 Oaks Cir Unit 926B
- 926 6 Oaks Cir Unit A
- 926 Six Oaks Cir Unit B
- 926 Six Oaks Cir Unit A
- 926 Six Oaks Cir
- 926 Six Oaks Cir Unit 926B
- 926 Six Oaks Cir Unit A
- 926B Six Oaks Cir Unit 926B
- 894 Six Oaks Cir
- 894 Six Oaks Cir
- 894 Six Oaks Cir Unit A
- 907 Six Oaks Circle Unit#b
- 907 Six Oaks Cir Unit A
- 907 Six Oaks Cir Unit 907A
- 907 Six Oaks Cir Unit B
- 880 Six Oaks Cir Unit A